
Analytics Report
The Report tab in Analytics shows how MIDA protected your store over time.
- In the MIDA Fraud app, go to Analytics and open the Report tab.
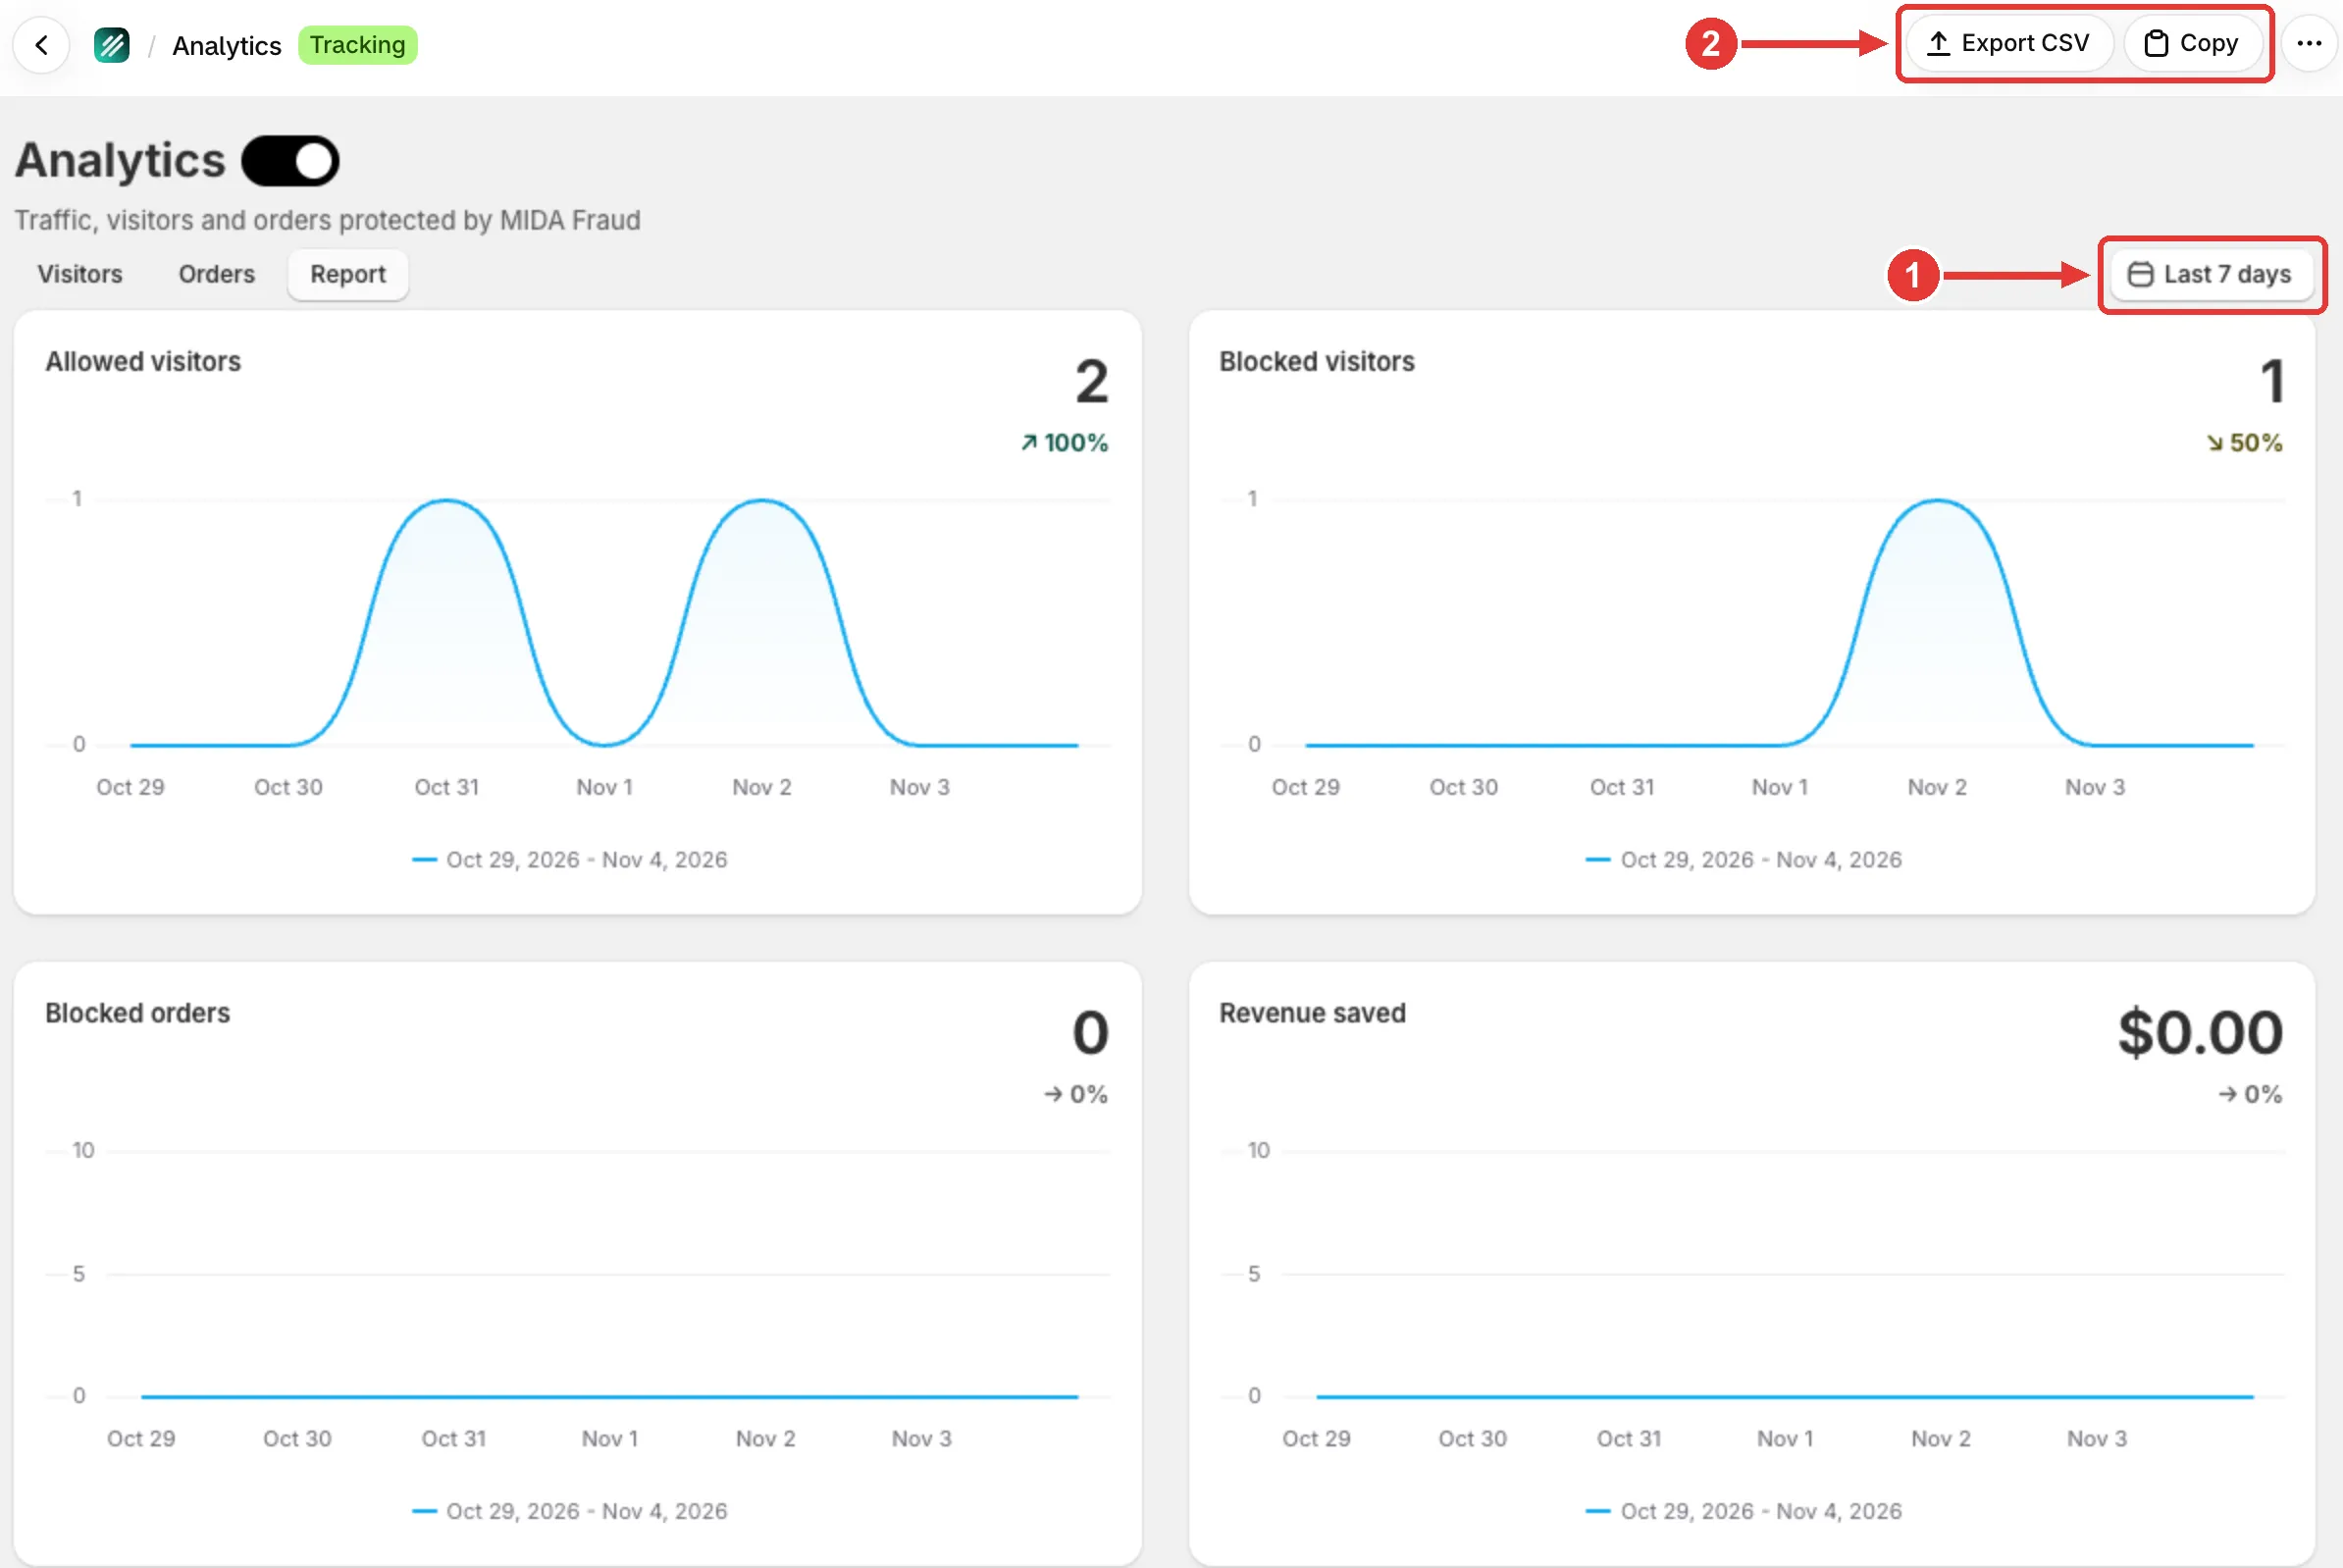
- Choose a date range (1). The report compares it with the previous period of the same length.
Key Numbers
Section titled “Key Numbers”Four cards show the totals for the period, a daily chart, and the change compared with the previous period:
| Card | What it shows |
|---|---|
| Allowed visitors | Visitors who could access your store |
| Blocked visitors | Visitors who were blocked |
| Blocked orders | Checkouts stopped by Checkout Protection |
| Revenue saved | The total value of the blocked orders |
Charts
Section titled “Charts”| Chart | What it shows |
|---|---|
| Visitors Breakdown | Total, allowed, blocked, and bot visitors per day |
| Blocked Traffic Sources | Why visitors were blocked, for example bots, rules, VPN, or proxy |
| Total Orders Risk | Your orders grouped by risk level, which shows the quality of your incoming traffic |
| Checkout Attempts Over Time | Allowed and blocked checkouts per day, with the block rate: blocked checkouts ÷ (allowed + blocked) × 100 |
Hover over a chart to see the numbers for each day.
Export the Report
Section titled “Export the Report”Click Export CSV (2) to download the daily numbers, or Copy to copy them and paste into a spreadsheet.
Visitor numbers only include visits recorded while visitor tracking was on. See Enable Visitor Tracking.
If you have any questions, feel free to contact us via Crisp Chat or email us at [email protected].