
Revenue Heatmap
Revenue Heatmap helps you identify which elements on your page are actually generating revenue. Instead of just showing where users click, it connects click data with real Shopify orders in the same session — so you can see exactly which banners, product cards, or CTAs drive sales.
This feature is designed for merchants who want to measure the profitability of each clickable element and optimize layout, CTAs, and marketing campaigns based on real revenue data.
.X5Nz9bvf_NrbJw.webp)
Top panel
Section titled “Top panel”The top panel helps you filter the Revenue clicks data and actions for them.
1. URL: This autofill URL based on the page you choose from the Heatmap list page.
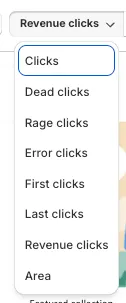
2. Heatmap type: Choose Revenue clicks to display only sessions that generated revenue (revenue > 0). This lets you see which areas were clicked AND actually produced orders.
3. Device counters: The numbers next to the device icons show the pageviews for that URL on Desktop, Tablet, and Mobile.
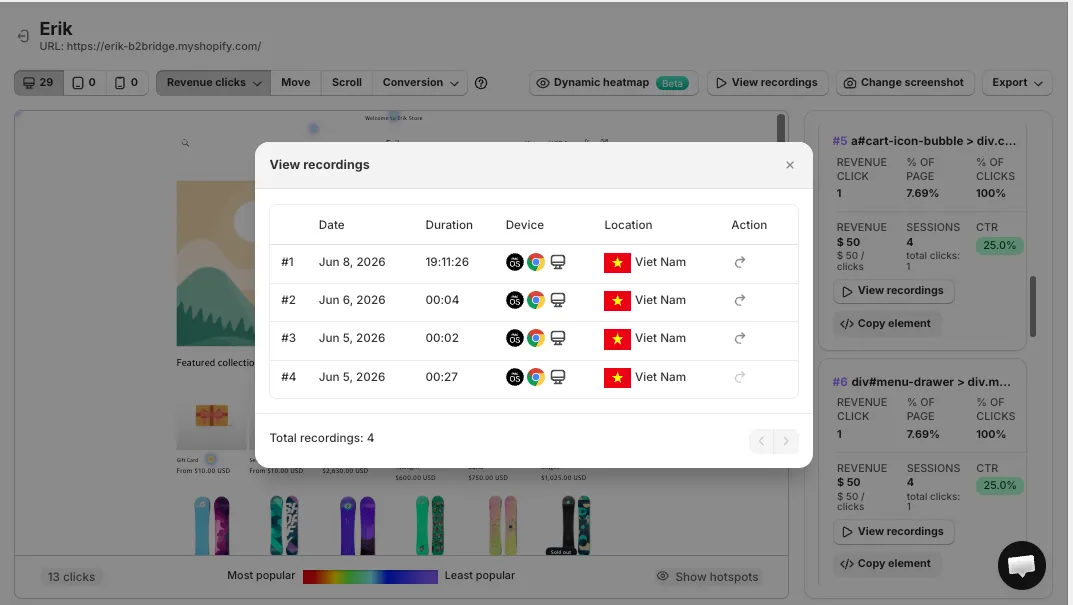
4. View recordings: View recordings helps you watch all sessions that included this URL.
5. Change screenshot: Allows you to update the page screenshot used as the heatmap background.
6. Export: Export all elements of the pageview that generated revenue. If the data is too large, the export will be sent to your email instead.
Heatmap panel
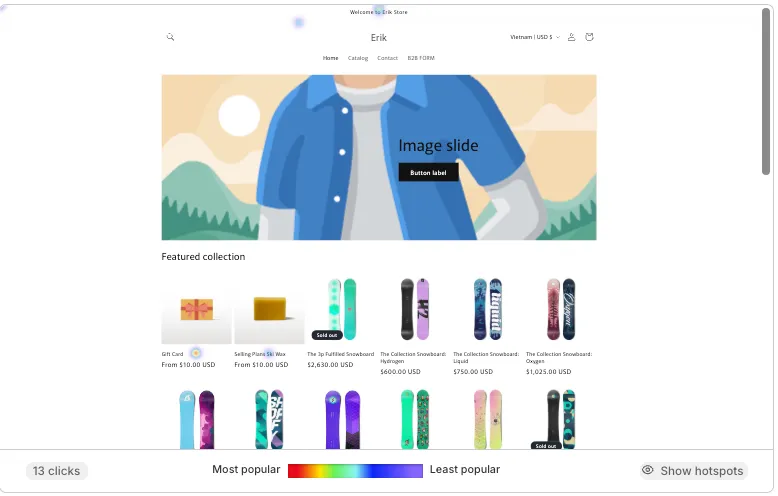
Section titled “Heatmap panel”Revenue clicks are represented on the heatmap. Only clicks from sessions that generated revenue are displayed, so the warmer areas show where revenue-driving interactions happen.
At the bottom of the Heatmap panel, there are:
- Revenue clicks count: The total number of revenue-generating clicks on the page (e.g. “13 clicks”).
- Color scale: Colors get warmer as popularity increases — from Most popular to Least popular. The warmer the colors, the denser the revenue clicks.
- Show hotspots: Toggle to highlight the revenue hotspot areas on the page.
Sidebar panel
Section titled “Sidebar panel”The sidebar panel lists elements ranked by the number of clicks, titled “Elements in order of number of clicks”, with the total element count displayed below (e.g. “13 elements”).
Each element card shows a full set of revenue metrics so you can compare and evaluate performance directly.
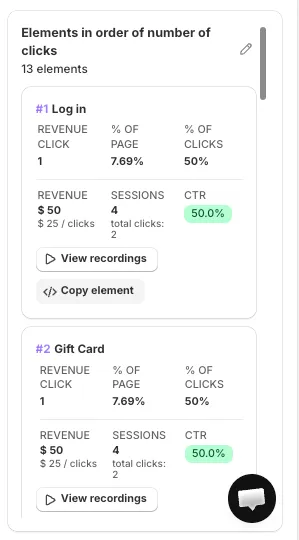
Element revenue metrics
Section titled “Element revenue metrics”For each ranked element, the following metrics are displayed:
- Revenue click: The total number of revenue-generating clicks on the element.
- % of page: The percentage of this element’s revenue clicks compared to all clicks on the pageview.
- % of clicks: The percentage of this element’s revenue clicks compared to all clicks on that element.
- Revenue: The total revenue from sessions that clicked this element (e.g. “$50”), with the per-click value shown below (e.g. “$25 / clicks”).
- Sessions: The total number of sessions that clicked this element, with total clicks shown below (e.g. “4 total, clicks: 2”).
- CTR: Click Through Rate — total clicks on the element divided by total sessions on the page, shown as a percentage badge (e.g. “50.0%”).
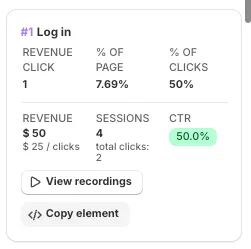
View recordings
Section titled “View recordings”View recordings helps you watch recordings where the element was clicked.
Copy element
Section titled “Copy element”This copies the CSS selector of an element, allowing you to identify the exact element in the UI. You can use it to change the style of an element.
Dashboard table
Section titled “Dashboard table”A Revenue per Click table is also available in the Analytic Insight page (below the funnel section), giving you a site-wide view across pages.
The table includes the following columns:
| Column | Description |
|---|---|
| URL | The page where the element appears |
| Element Name / Selector | The name or identifier of the clicked element (name is used if available) |
| Total Clicks | Total number of clicks on the element |
| Total Revenue | Total revenue from sessions that clicked the element |
| Revenue per Click (RPC) | Average revenue per click |
| View Sessions | Number of sessions that clicked the element |
The table supports:
- Sorting by Total Clicks or Total Revenue to find your most profitable blocks
- Search by block name
- Merge blocks with the same name
- Export of all site-wide elements filtered by date range (sent via email if too large)

If you have any questions, feel free to contact us via Crisp Chat or email us at [email protected].