
Dynamic Heatmap
Dynamic Heatmap lets you view heatmap data directly on your live storefront instead of on a static snapshot. As you browse and interact with your store as a real visitor would, heatmap data updates and follows you across every page.
This means you can navigate naturally — click into collections, open product pages, scroll through content — and see aggregated visitor behavior overlaid live on the actual page you are viewing.
You can switch between Click, Move, and Scroll heatmaps, change the device viewport, and adjust the time period without leaving the store.
How is it different from a standard Heatmap?
Section titled “How is it different from a standard Heatmap?”Standard heatmaps render on a static snapshot of a single page. Dynamic Heatmap renders directly on the live store, so the heatmap stays accurate to the real, current state of each page and follows you as you move between pages.
How to use Dynamic Heatmap
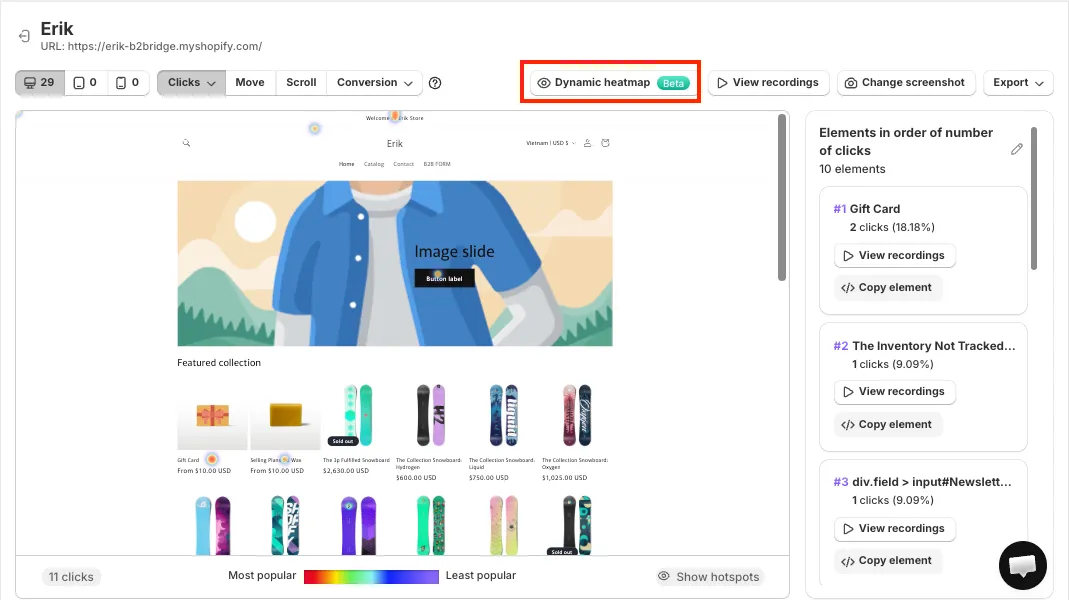
Section titled “How to use Dynamic Heatmap”Step 1: Open Dynamic Heatmap from the normal heatmap section on any pages to launch your live storefront with the MIDA Heatmap control panel.
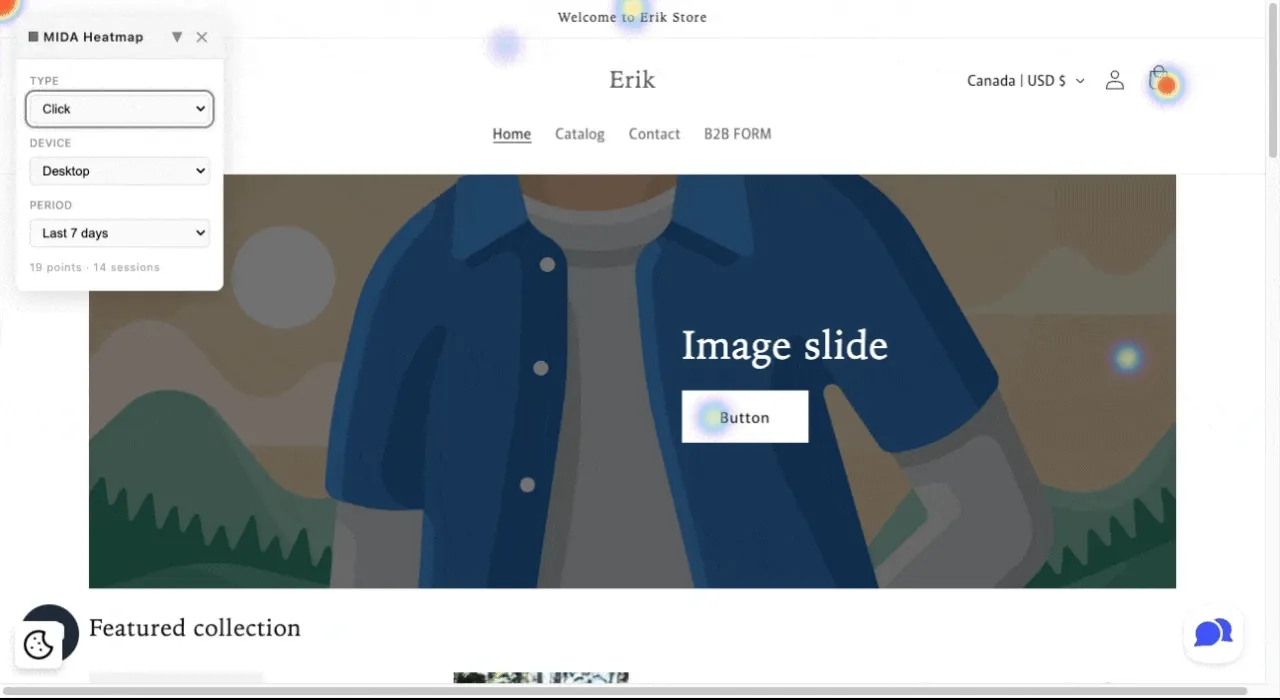
Step 2: The floating MIDA Heatmap panel appears on the left of your store. Use it to control everything about your heatmap view.
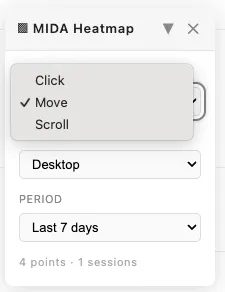
Step 3: Choose the Type of heatmap you want to view:
- Click: where visitors click most on the page
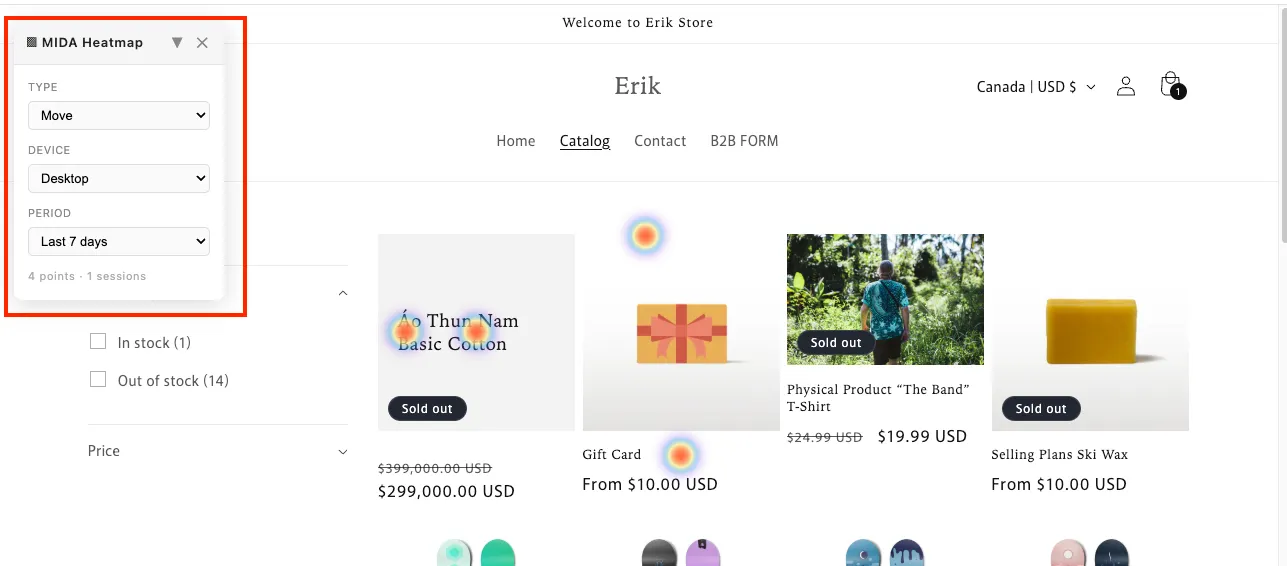
- Move: where visitors move their cursor most
- Scroll: how far down the page visitors scroll
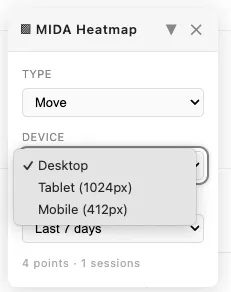
Step 4: Choose the Device viewport to see how behavior differs across devices:
- Desktop
- Tablet (1024px)
- Mobile (412px)
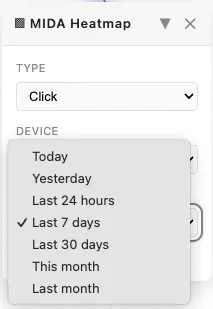
Step 5: Select the Period to filter the date range of the data:
- Today
- Yesterday
- Last 24 hours
- Last 7 days
- Last 30 days
- This month
- Last month
Step 6: Browse your store normally. Navigate to any page — collection, product, cart — and the heatmap data automatically follows and updates for the page you are viewing.
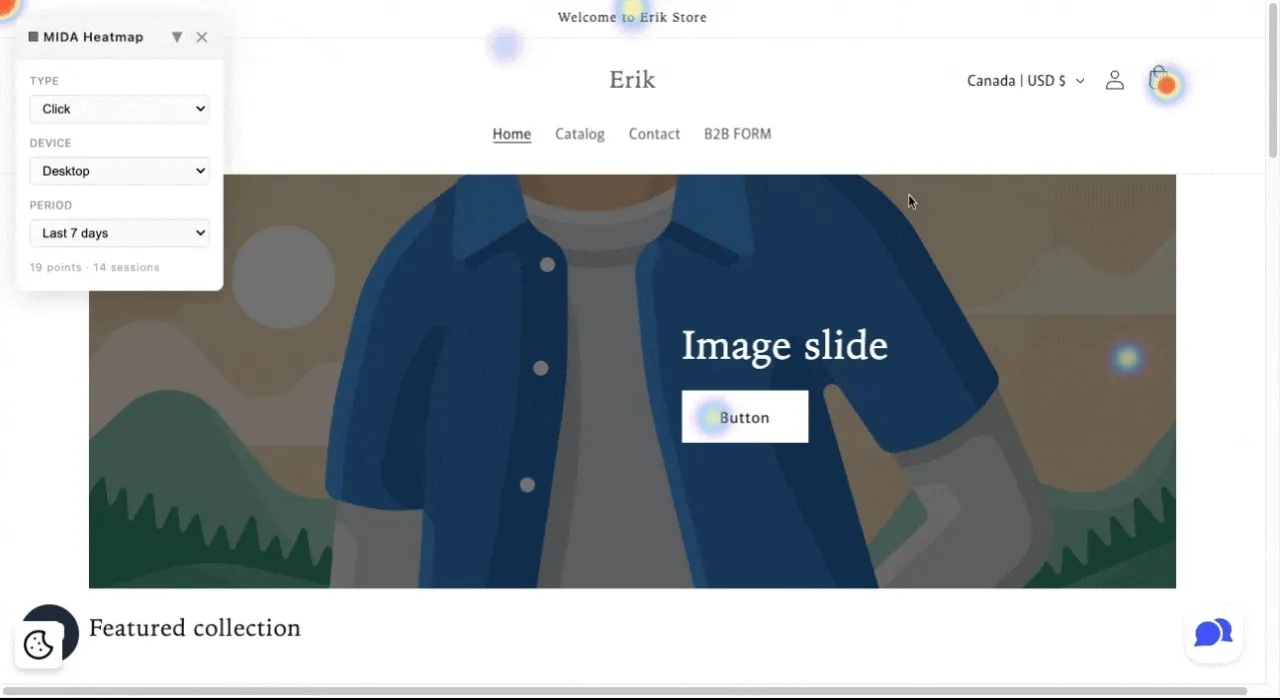
Step 7: At the bottom of the panel, you can see the points and sessions count for the current view, including the number of tracked data points and sessions feeding the heatmap.
The color of the heatmap indicates the frequency of user activity in a particular area of the page. Warmer colors mean denser activity. Use these insights to optimize layout, navigation, and calls to action directly in the context of your real store.
If you have any questions, feel free to contact us via Crisp Chat or email us at [email protected].