
Search Insight
Using Search Insight to Understand On-site Search Behavior: A Step-by-Step Guide
Section titled “Using Search Insight to Understand On-site Search Behavior: A Step-by-Step Guide”The Search Insight feature helps you analyze how customers use search on your store. By doing so, you can discover what visitors are looking for, spot keywords that return no results, find revenue opportunities, and improve product discovery and conversion.
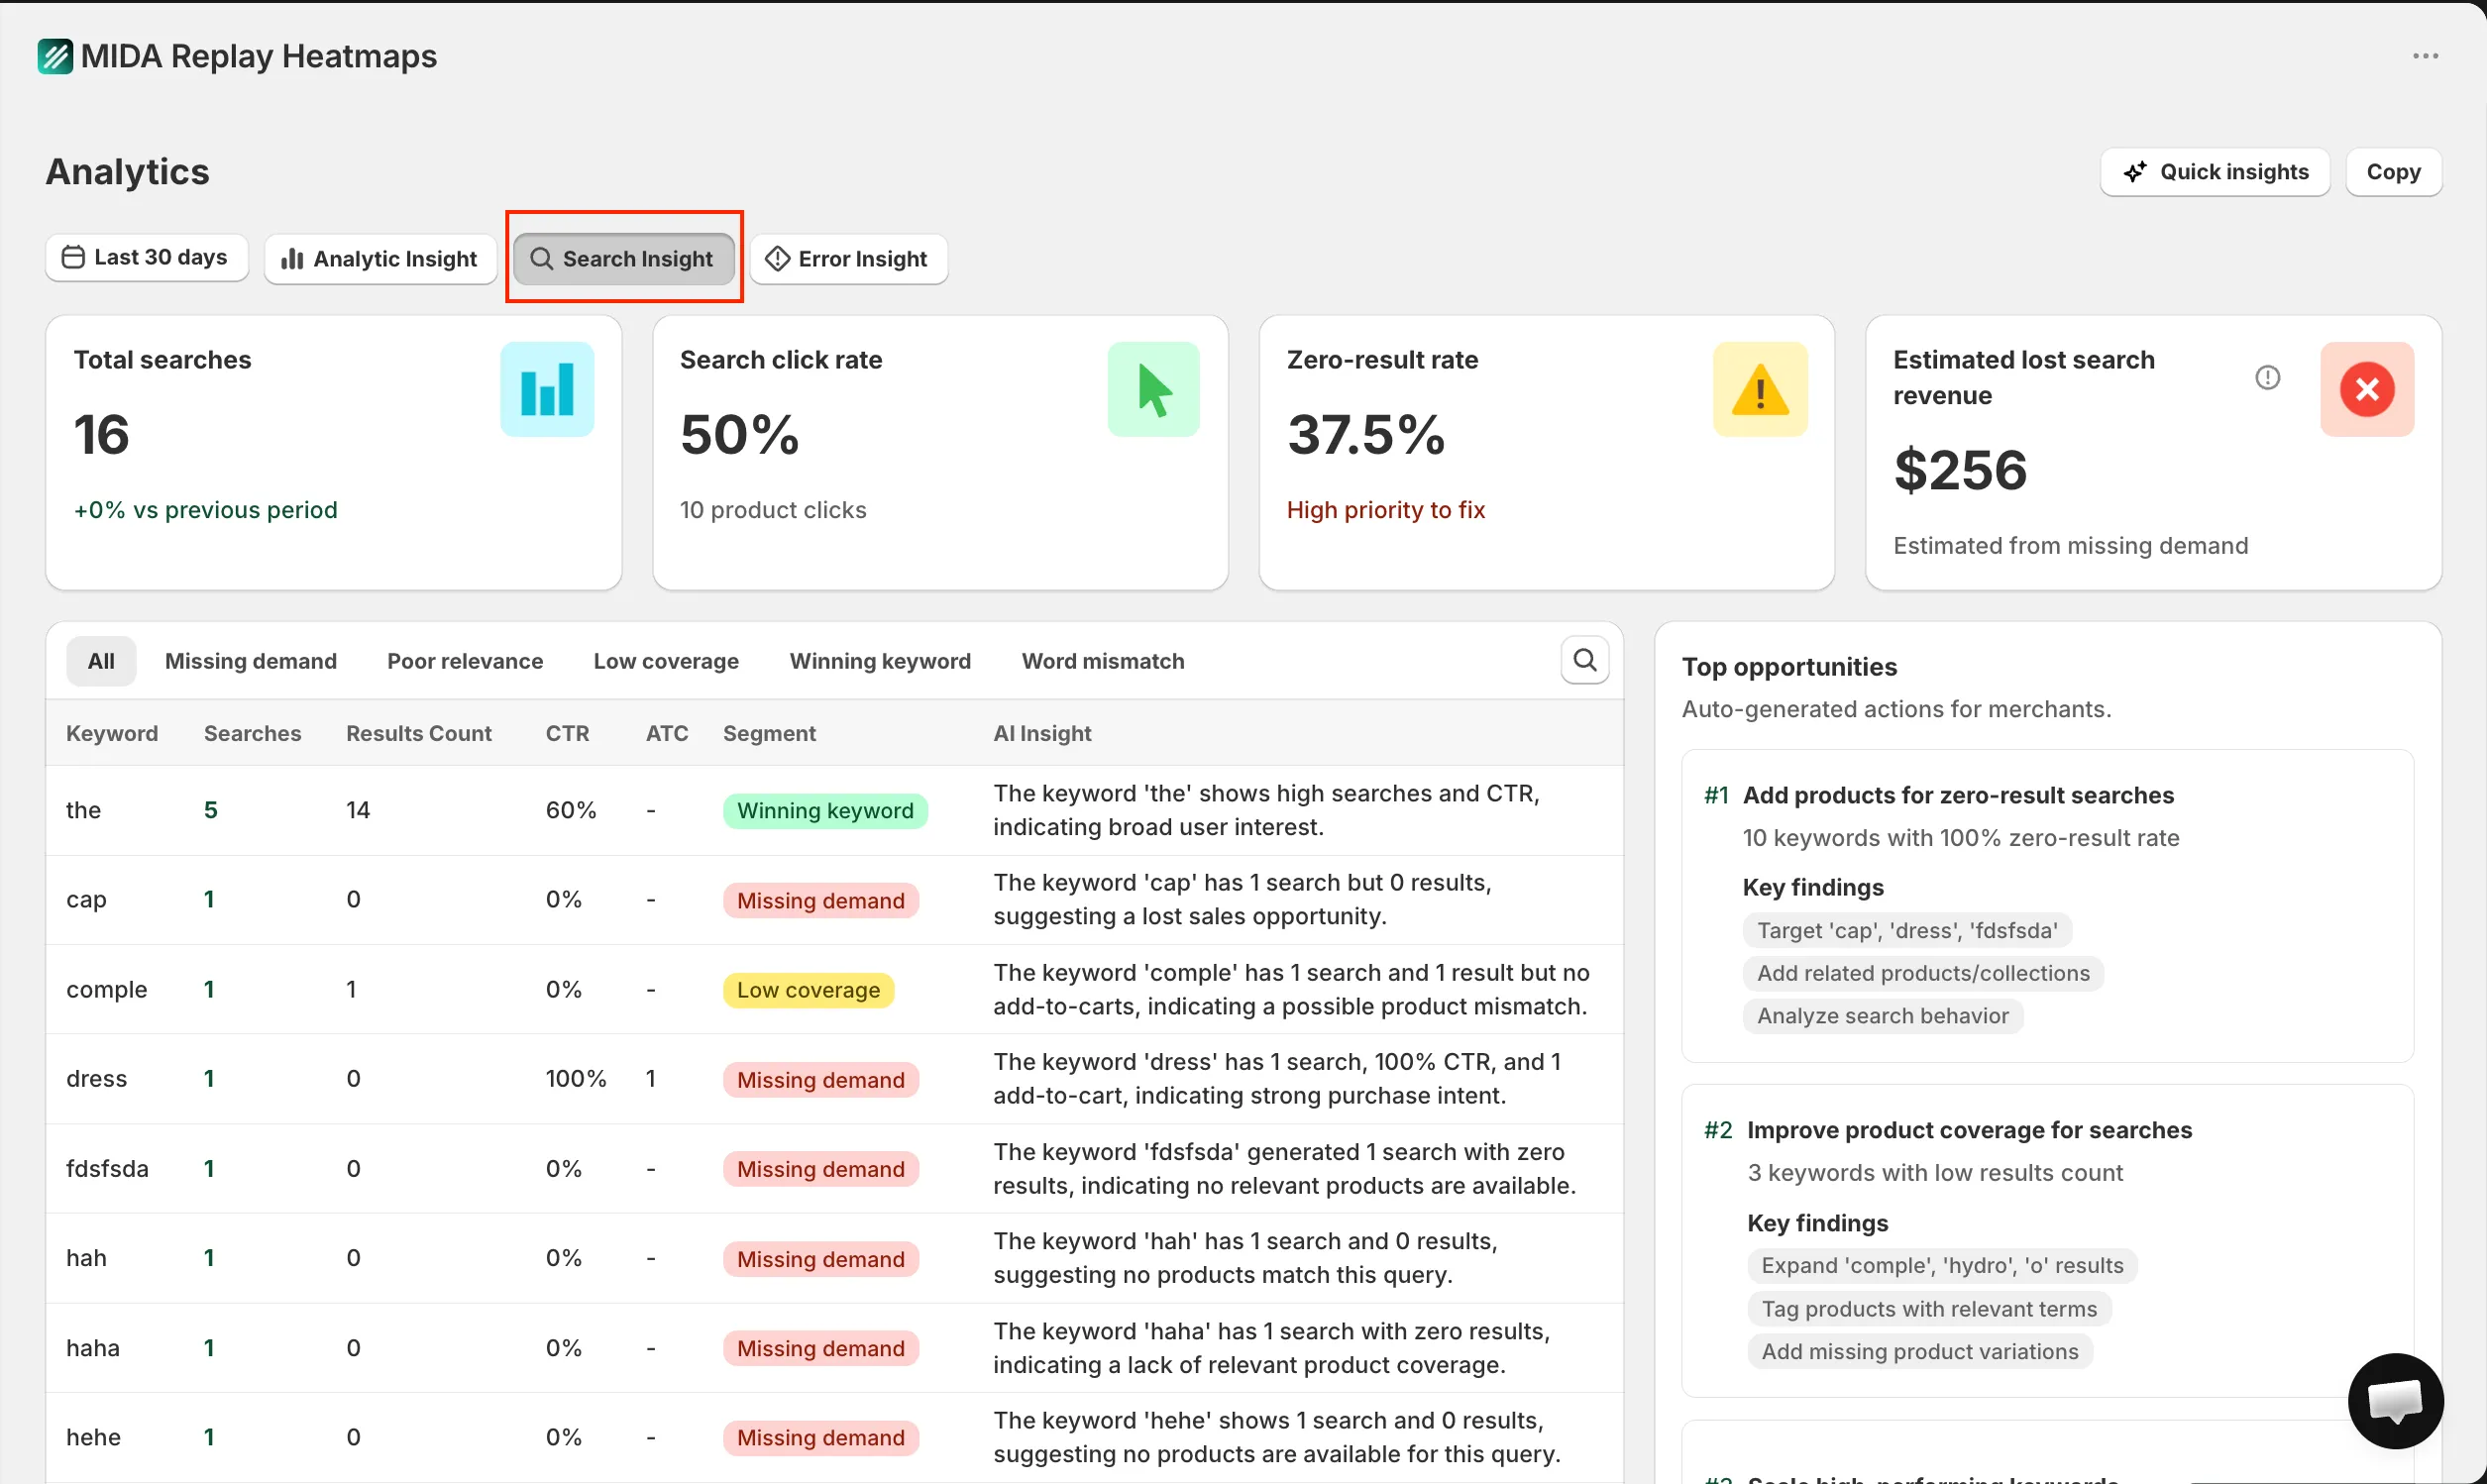
Step 1: Navigate to the “Analytics” tab in the app’s main menu, then select Search Insight.
Step 2: Select the date range.
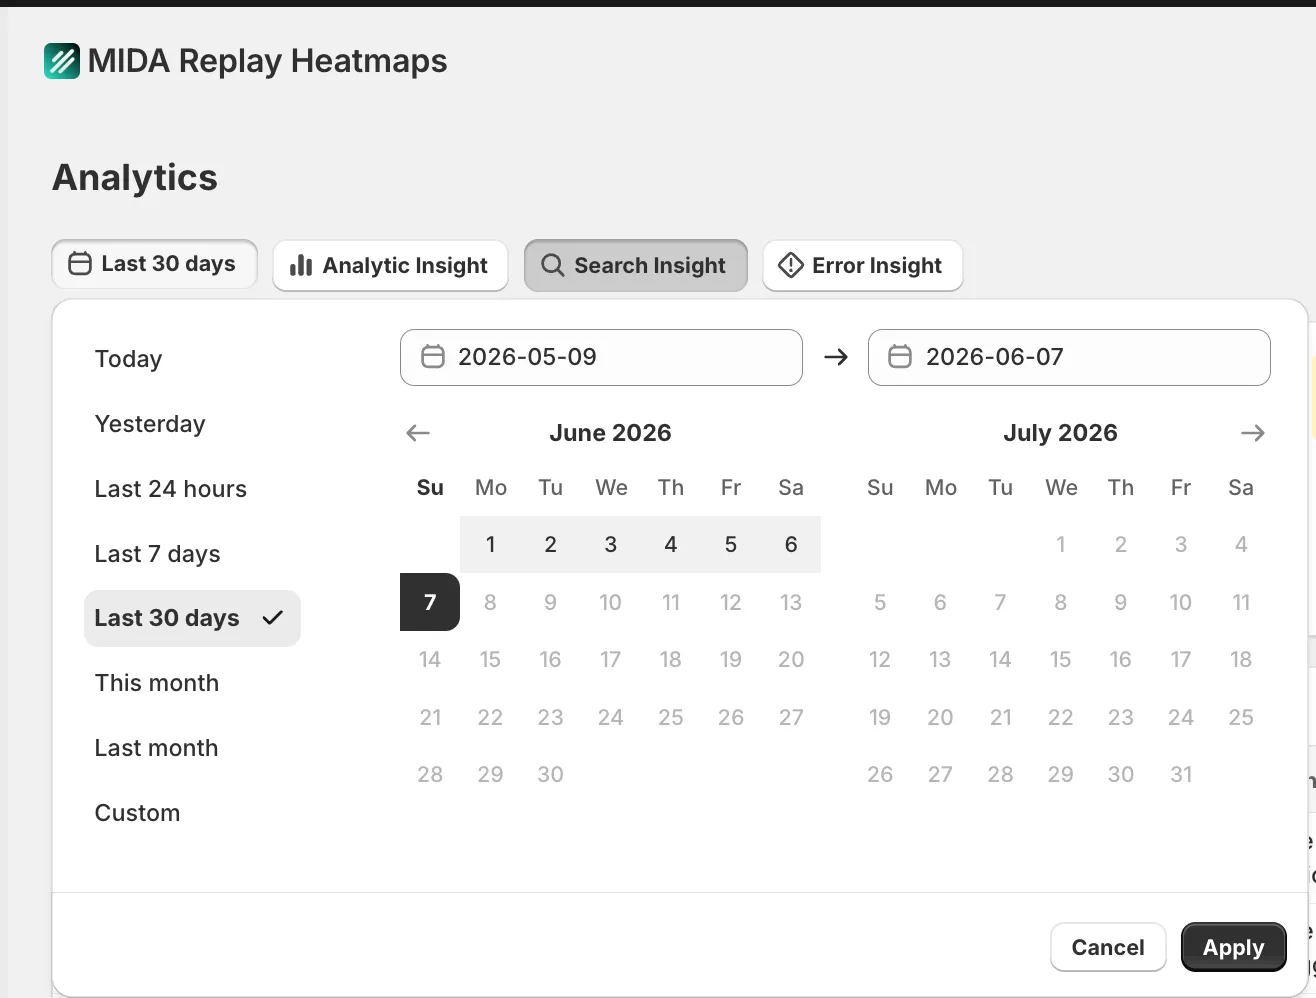
You can filter by default presets or set a custom range in the calendar. Please note that you cannot select future dates.
Step 3: Explore the insights from the provided metrics.
Summary Metrics
Section titled “Summary Metrics”At the top of the dashboard, you can see 4 summary metric cards that give you a quick overview of search performance.
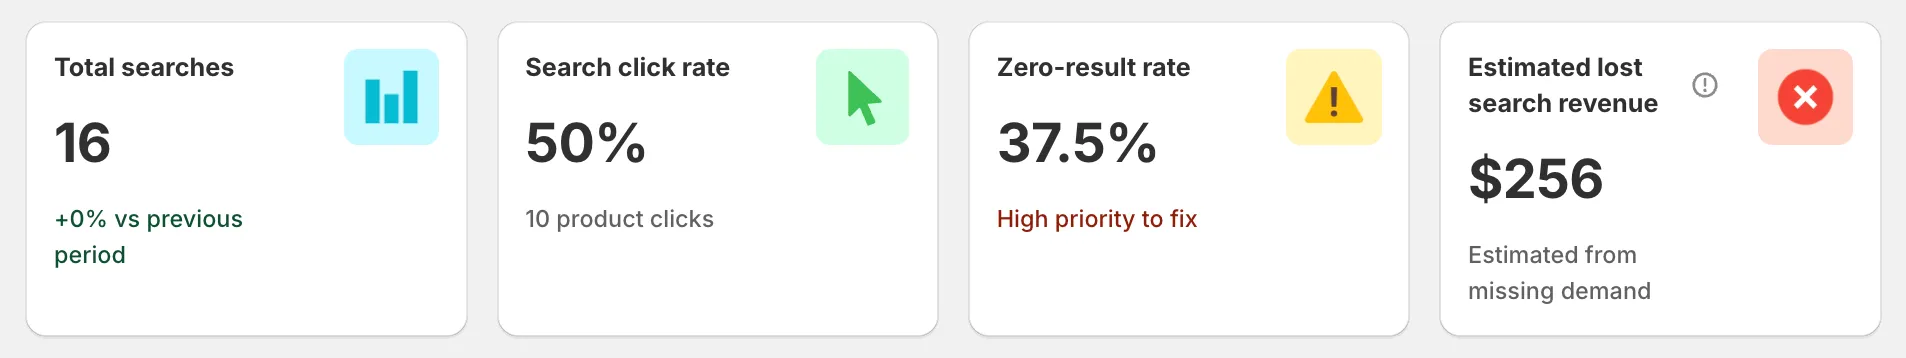
- Total searches: Total number of search events in the selected date range. The subtitle compares this with the previous period (e.g. “+12.3% vs previous period”).
- Search click rate: Percentage of searches that led to a product click. The subtitle shows the total number of product clicks.
- Zero-result rate: Percentage of searches that returned no results. A priority status is shown based on the rate (e.g. “High priority to fix”, “Medium priority”, “Healthy search coverage”).
- Estimated lost search revenue: Estimated revenue opportunity lost from searches that returned no results. Displayed in your store currency.
💡 Hover over the tooltip icon on Zero-result rate and Estimated lost search revenue to see what each metric measures.
Keyword Analytics
Section titled “Keyword Analytics”This table shows the performance of each keyword customers searched for, so you can identify what is working and what needs attention.
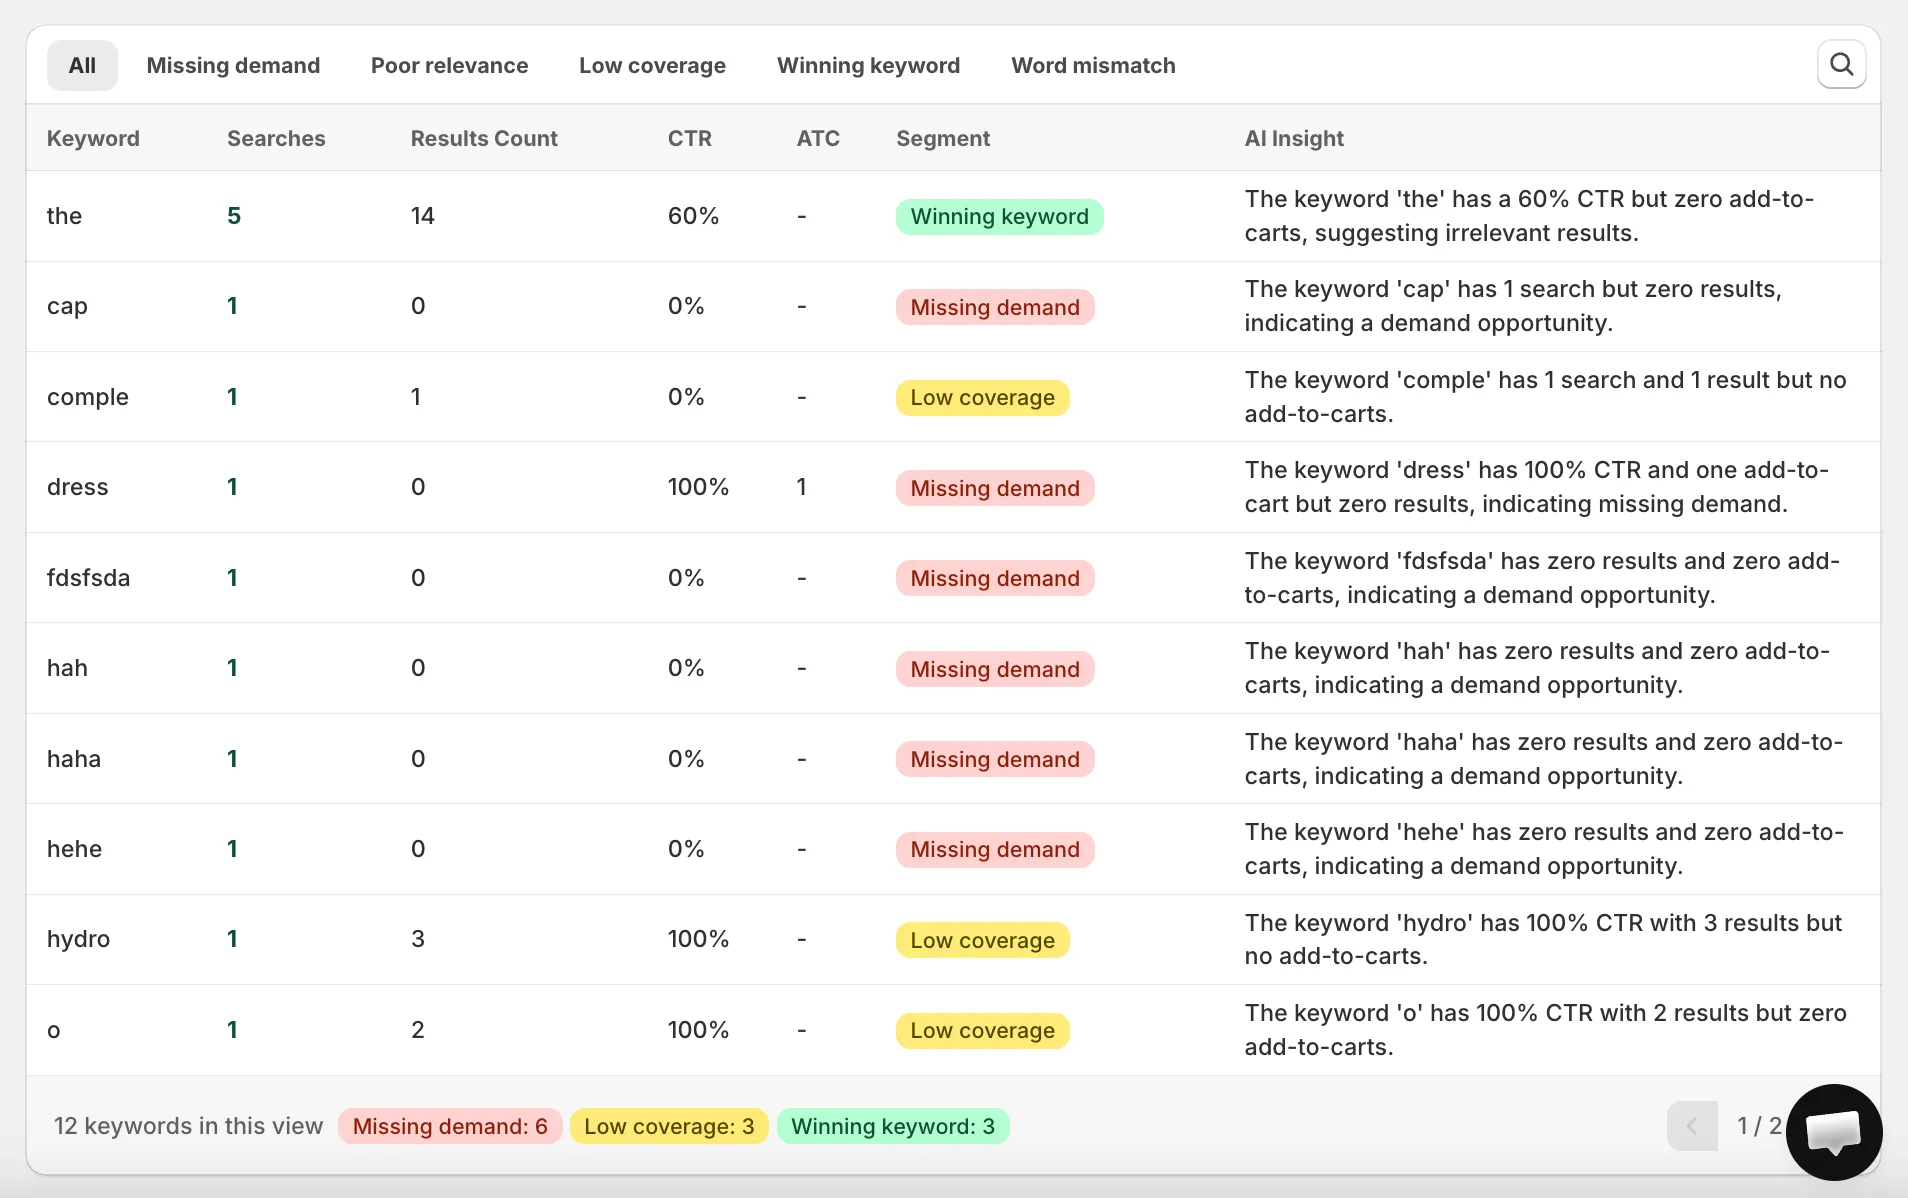
The table includes the following columns:
- Keyword: The term the customer searched for.
- Searches: Total number of searches for that keyword.
- Results Count: Number of products/results returned for that keyword.
- CTR: Percentage of searches that led to a product click.
- ATC: Total add-to-cart actions from that keyword.
- Segment: Keyword classification (see below).
- AI Insight: AI-generated recommendation for that keyword.
Filtering by Segment
Section titled “Filtering by Segment”You can filter keywords by segment using the tabs above the table. The filter works in real time without reloading the page.
- All: All keywords.
- Missing demand: Customers searched but no results were returned — a lost sales opportunity.
- Poor relevance: Results were returned but customers rarely clicked — results may not match the query.
- Low coverage: Customers clicked well, but very few results were available.
- Winning keyword: High-performing keywords with strong click and add-to-cart rates.
- Word mismatch: Many results returned but almost no clicks — the customer’s wording may differ from your product naming/tagging.
💡 Each keyword belongs to only one segment, assigned by priority order.
AI Insight
Section titled “AI Insight”The AI Insight column provides an AI-generated recommendation based on each keyword’s segment. For example, a “Missing demand” keyword may suggest creating a collection or adding products/tags for that term.
🔒 AI Assistant add-on required. If your store does not have the AI Assistant add-on active, AI Insight content will be locked and blurred. Click “Unlock AI Assistant” to view full insights.
Top Opportunities
Section titled “Top Opportunities”The Top opportunities section highlights the most important issues and actions for your store, prioritized by impact (search volume, zero-result frequency, CTR, add-to-cart potential, and estimated revenue).
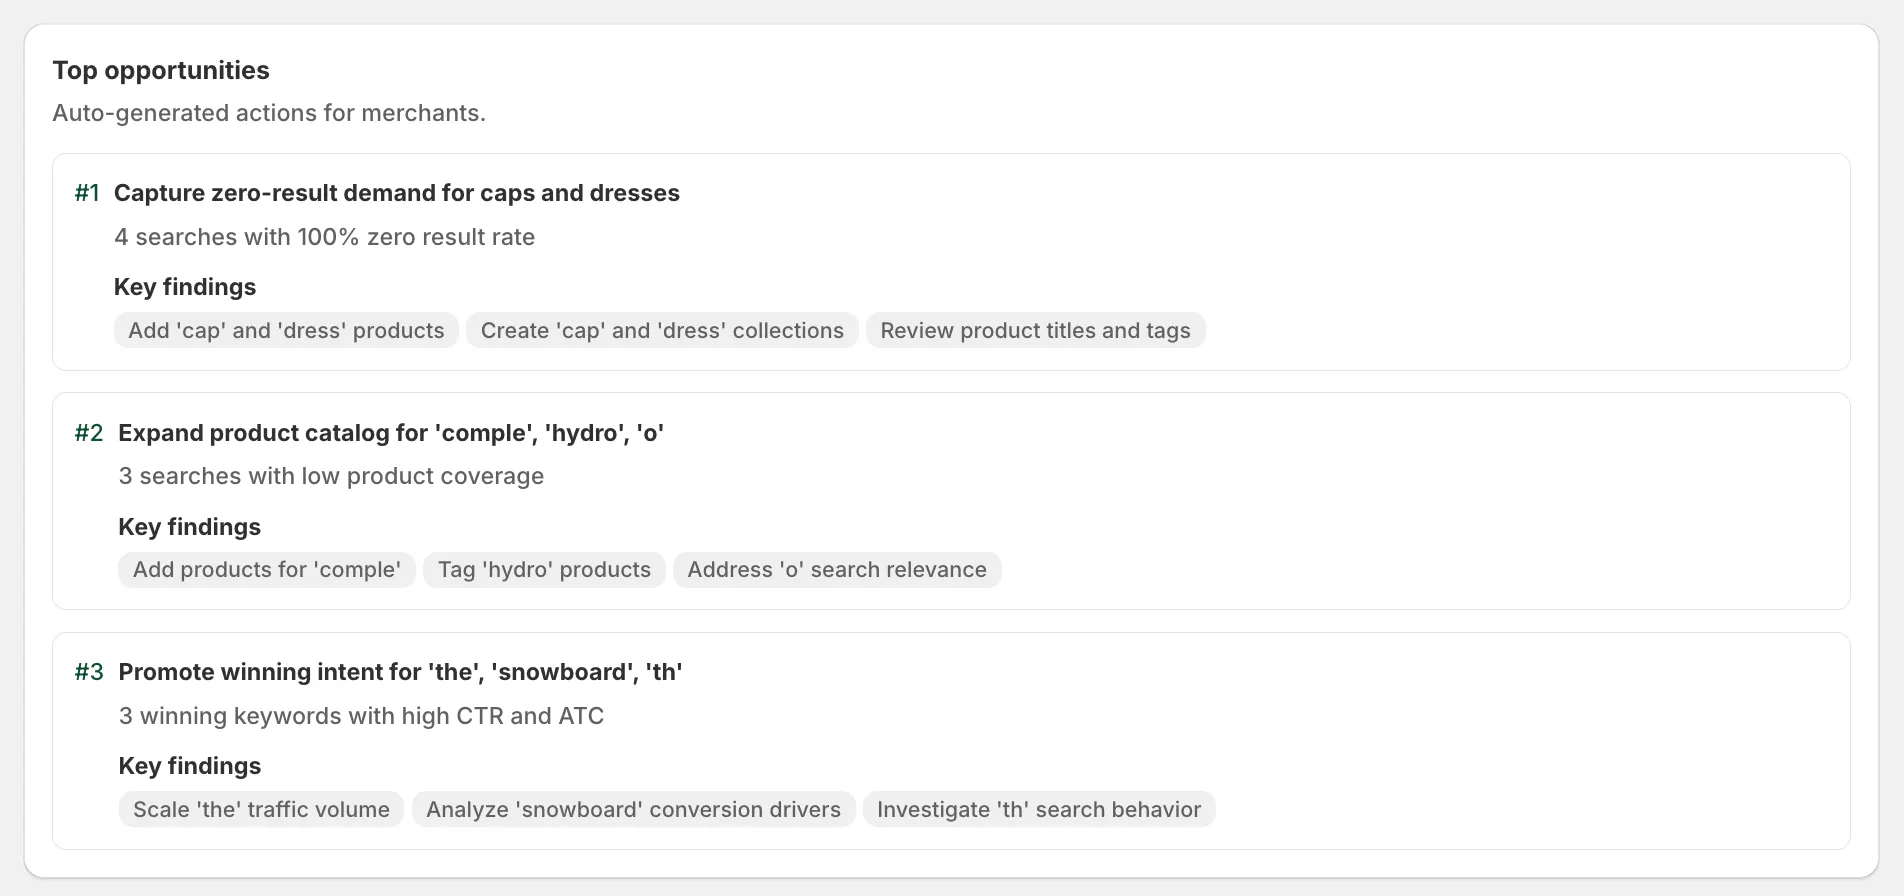
Each opportunity card includes a title and key findings with suggested actions.
🔒 AI Assistant add-on required. Without the add-on active, this section is locked and blurred. You can still see the section title and placeholder cards. Click “Unlock AI Assistant” to unlock.
Search Funnel
Section titled “Search Funnel”The Search Funnel gives you an overall view of the customer journey after a search, helping you find where customers drop off.
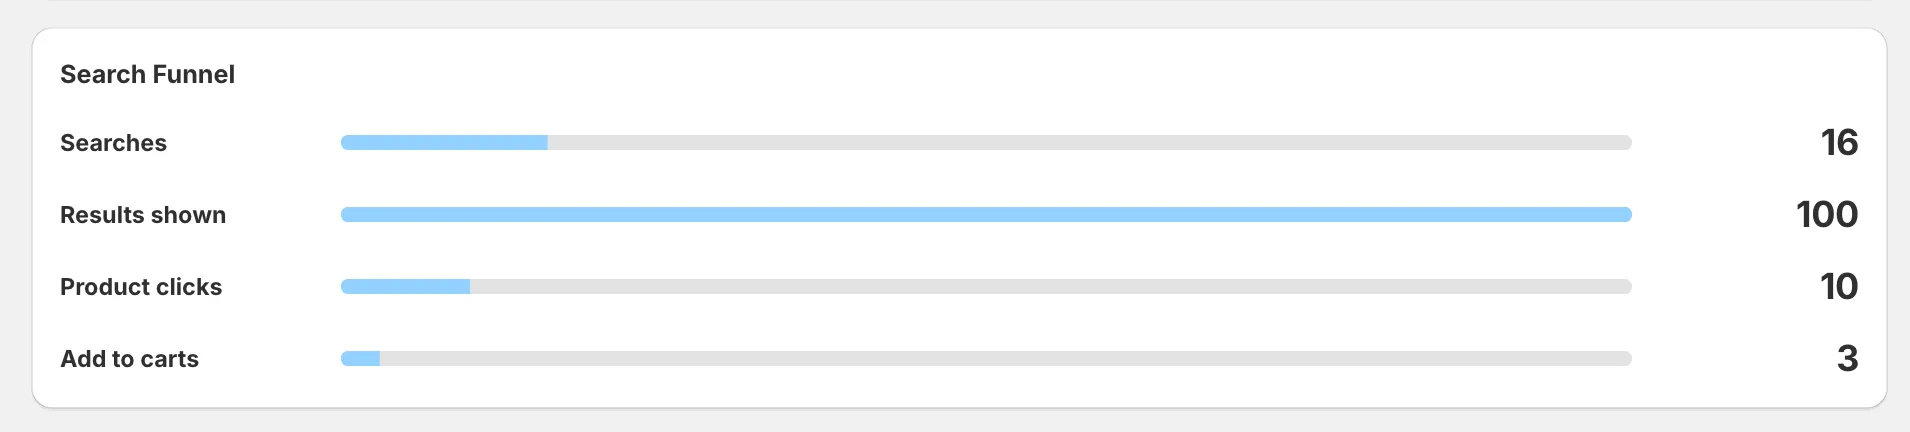
The funnel includes the following steps:
- Searches: Total number of search events.
- Results shown: Searches that returned at least one result.
- Product clicks: Searches that led to a product click.
- Add to carts: Searches that led to an add-to-cart.
If there is not enough data, the funnel displays “Not enough search data available” instead of empty values.
Search Journey Replay
Section titled “Search Journey Replay”This section connects keywords with the next customer actions by showing related session replays. The system displays sessions with the most search activity.
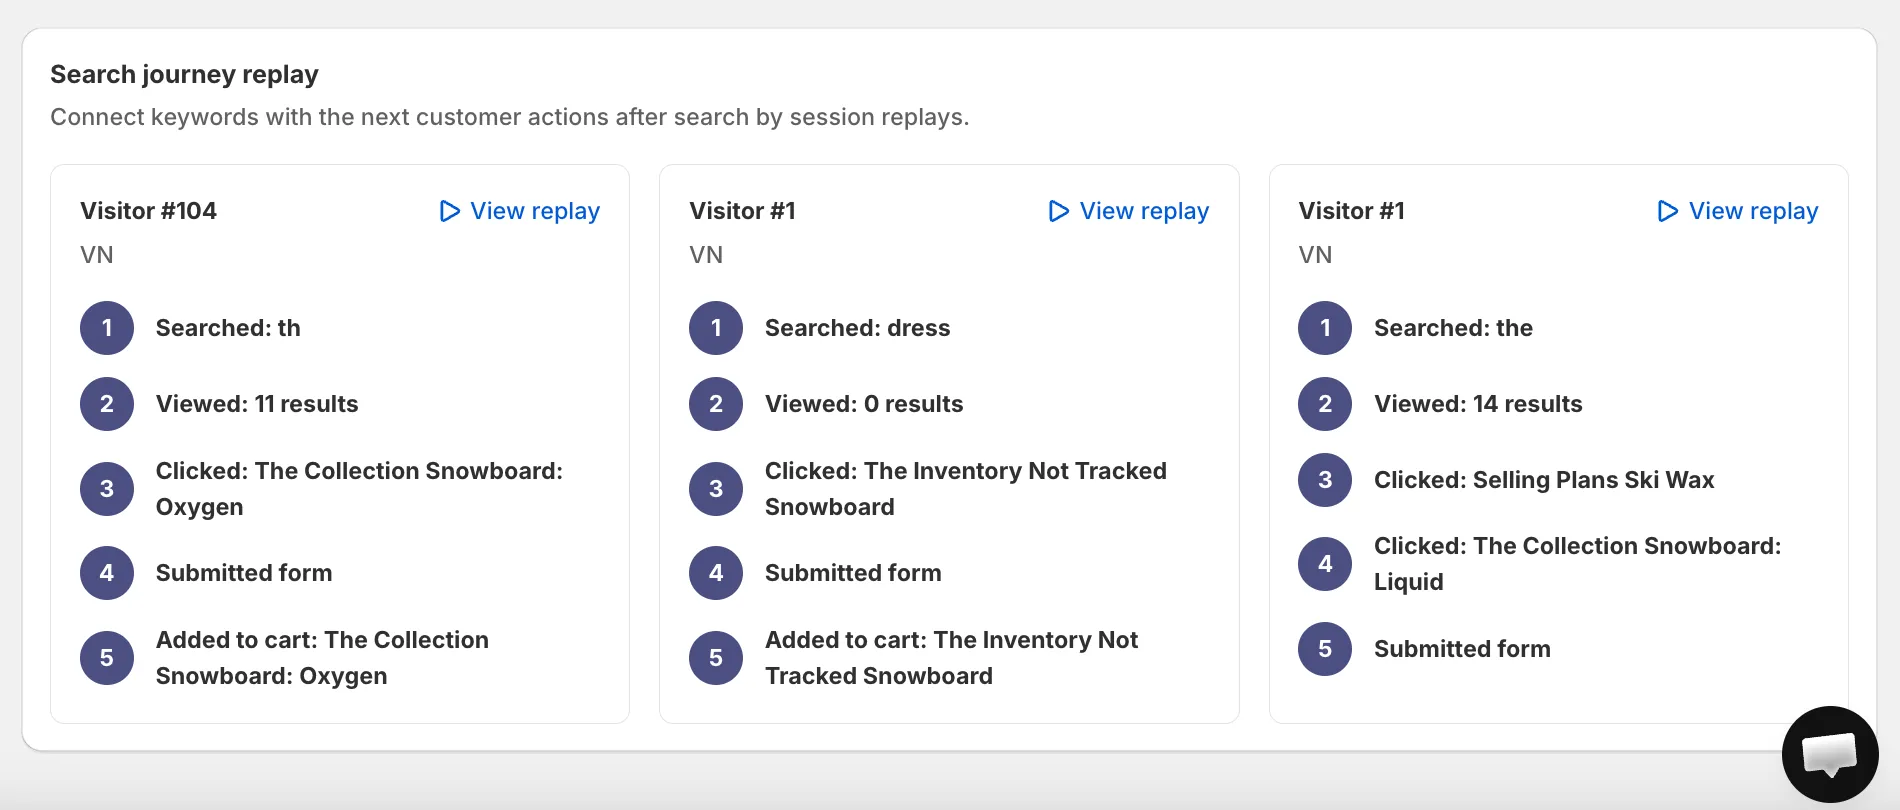
Each replay card shows:
- Session identifier and device/country
- The searched keyword
- The step-by-step journey after the search
- A View Replay link
Click View Replay on any card to open the full session replay and watch exactly what the customer did.
If you have any questions, feel free to contact us via Crisp Chat or email us at [email protected].