
Conversion maps
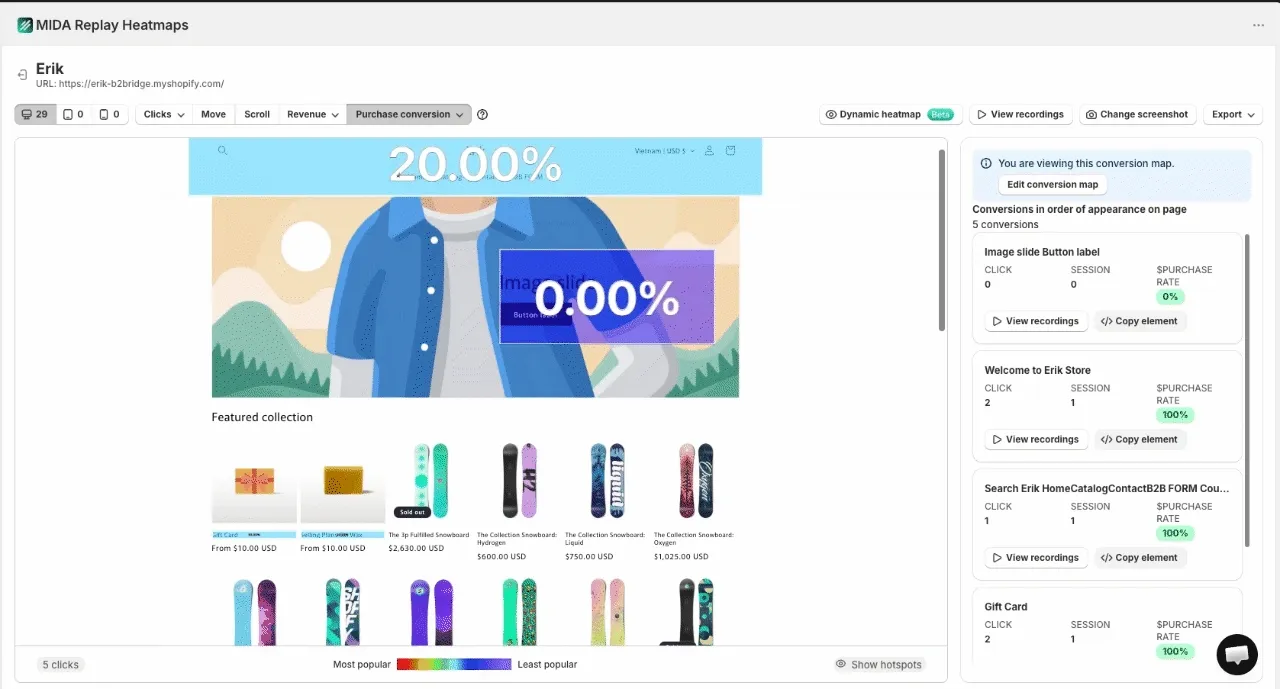
Conversion Heatmap helps you understand which areas on your page actually drive purchases or add-to-cart actions. Instead of only showing where users click, Conversion maps connect clicks to real business outcomes, so you can see exactly which blocks, banners, or elements contribute to your store’s conversion.
This data helps you optimize layout, CTAs, and product placement based on what genuinely converts visitors into buyers.
Top panel
Section titled “Top panel”The top panel helps you filter the Conversion map data and switch between conversion types.
1. Device: You can choose which device to view the heatmap on, including PC, Tablet, and Mobile. The number on the right side of each icon is the number of pageviews of that URL on that device.
2. Heatmap type: Conversion map is one of the heatmap types alongside Clicks, Move, and Scroll. Select the Purchase conversion dropdown to switch the conversion view.
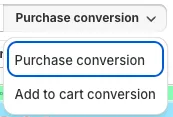
3. Conversion type dropdown: Within the Conversion map, you can switch between two conversion types:
- Purchase conversion: shows the percentage of sessions that resulted in a purchase after clicking in a selected area.
- Add to cart conversion: shows the percentage of sessions that resulted in an add-to-cart action after clicking in a selected area.
4. Dynamic heatmap (Beta): Switch to dynamic heatmap view to capture conversion data across dynamic page elements.
5. View recordings: View recordings helps you watch all sessions that included this URL.
6. Change screenshot: Select another screenshot to view the conversion map on.
7. Export: Export the conversion map data.
Heatmap panel
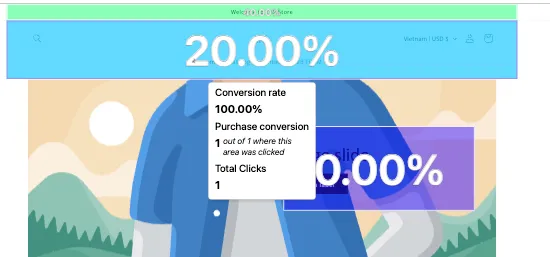
Section titled “Heatmap panel”The Conversion map overlays conversion rate directly on your page. Hover over any area to see its conversion details.
When you hover over an area, a tooltip displays:
- Conversion rate: the percentage of sessions that converted (purchase or add-to-cart) when a user clicked in that area.
- Conversion count: how many sessions out of the total clicked area resulted in a conversion (e.g. 1 out of 1 where this area was clicked).
- Total Clicks: the total number of clicks in that area.
At the bottom of the Heatmap panel, you can see:
- Clicks: the total number of clicks on the page for the applied device and conversion type.
- Color scale: Colors range from Most popular to Least popular. The warmer the color, the higher the conversion density in that area.

Edit Conversion map
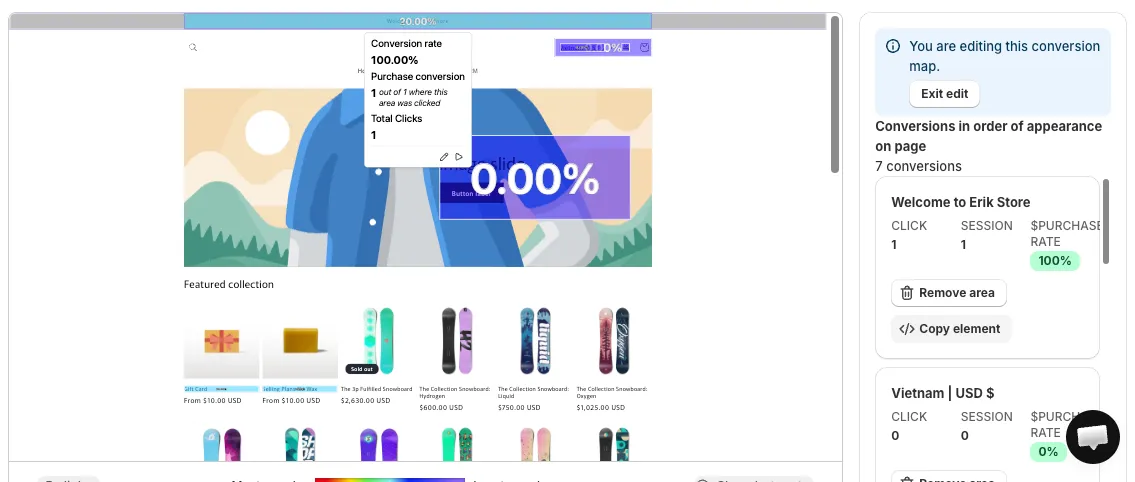
Section titled “Edit Conversion map”In Edit mode, you can select new regions on the map to measure conversion for custom areas. Click Edit conversion map in the sidebar panel to switch from viewing to editing.
You can select an area by clicking on the heatmap. The conversion rate and total clicks for the new area are calculated instantly in the tooltip. You can also remove an existing area using Remove area.
Select Exit edit when you finish editing. The updated Conversion map will then be shown.
Sidebar panel
Section titled “Sidebar panel”The sidebar panel lists all conversion areas in their order of appearance on the page. The header shows the total number of conversions detected (e.g. 4 conversions).
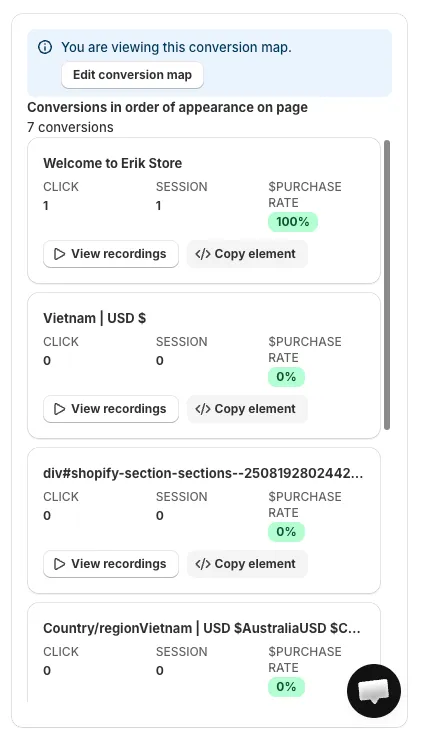
Conversion data
Section titled “Conversion data”Each area card displays:
- Click: total number of clicks in that area.
- Session: total number of sessions that clicked in that area.
- Purchase rate / ATC rate: the conversion rate of that area, depending on the selected conversion type (Purchase or Add to cart).
Select any area card to automatically navigate to that element on the Heatmap panel.
View recordings
Section titled “View recordings”View recordings helps you watch recordings where the element in that area was clicked.
Copy element
Section titled “Copy element”This copies the CSS selector of an element, allowing you to identify the exact element in the UI. You can use it to change the styling of that element.
If you have any questions, feel free to contact us via Crisp Chat or email us at [email protected].