
Error Insight
Using Error Insight to Find Storefront Issues That Hurt Revenue: A Step-by-Step Guide
Section titled “Using Error Insight to Find Storefront Issues That Hurt Revenue: A Step-by-Step Guide”The Error Insight feature helps you detect critical storefront errors that may cause lost revenue, such as add-to-cart failures, broken buttons, dead clicks, or third-party app conflicts. By doing so, you can understand which errors affect revenue the most, where they happen, what may be causing them, and review related session replays to investigate and prioritize fixes.
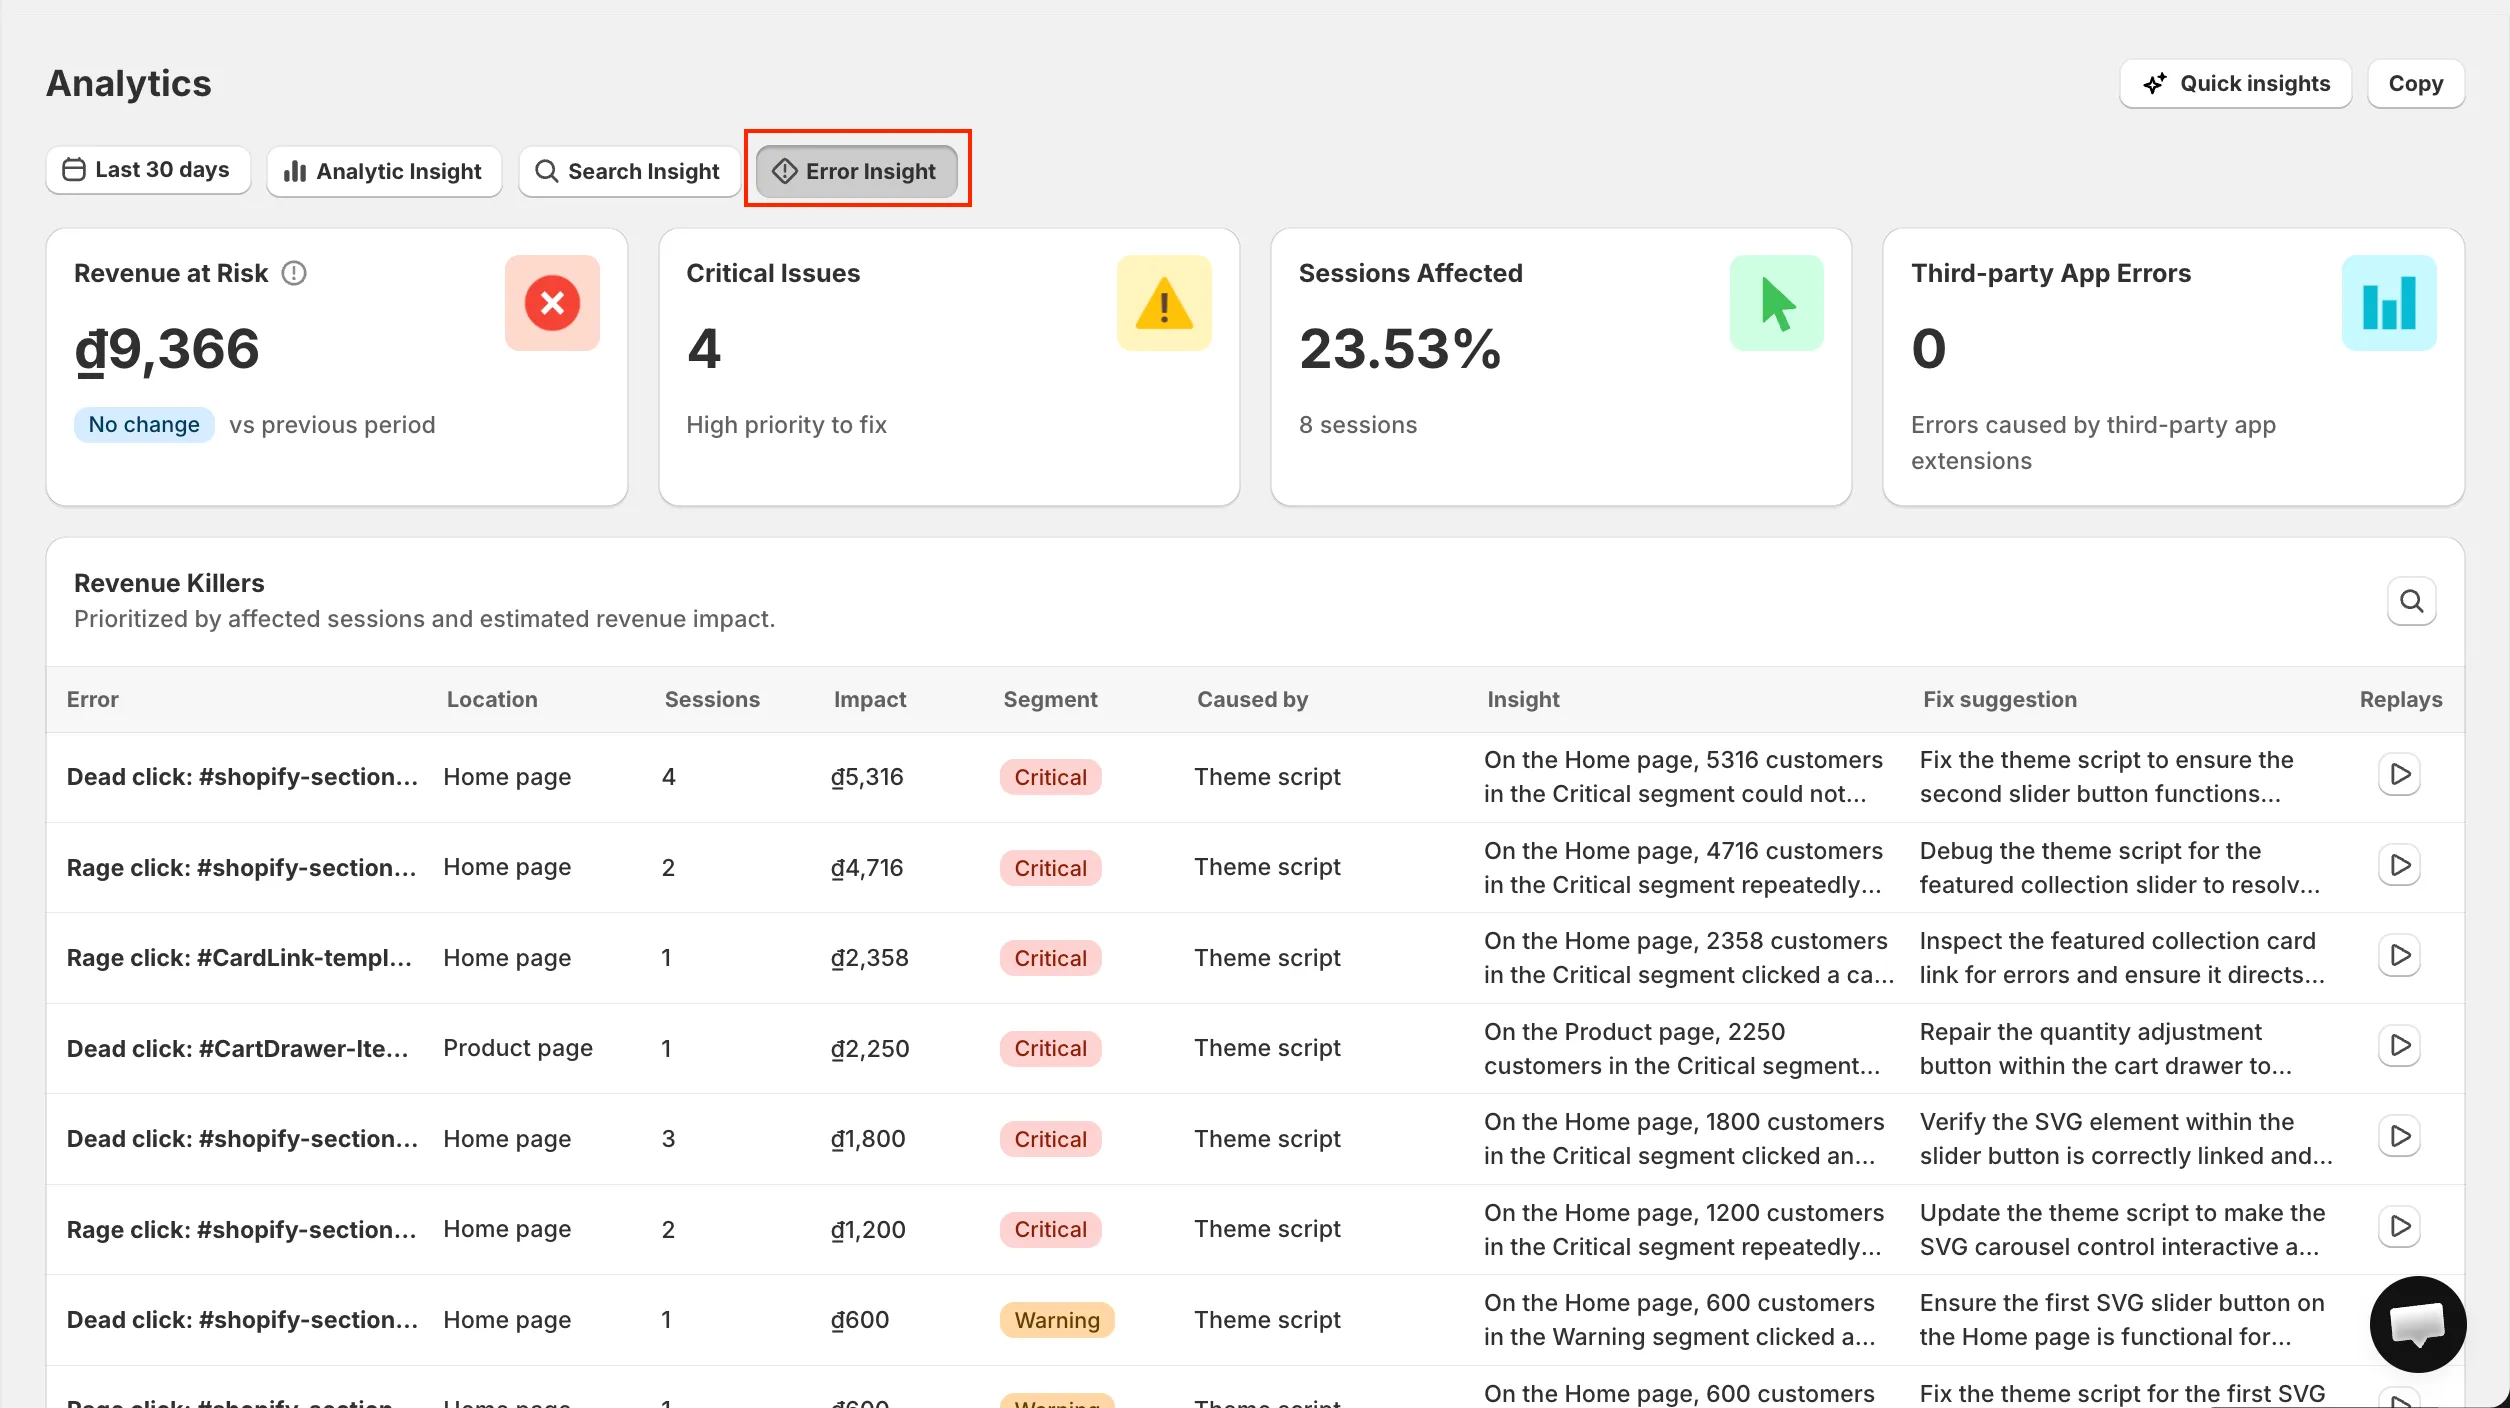
Step 1: Navigate to the “Analytics” tab in the app’s main menu, then select Error Insight.
Step 2: Select the date range.
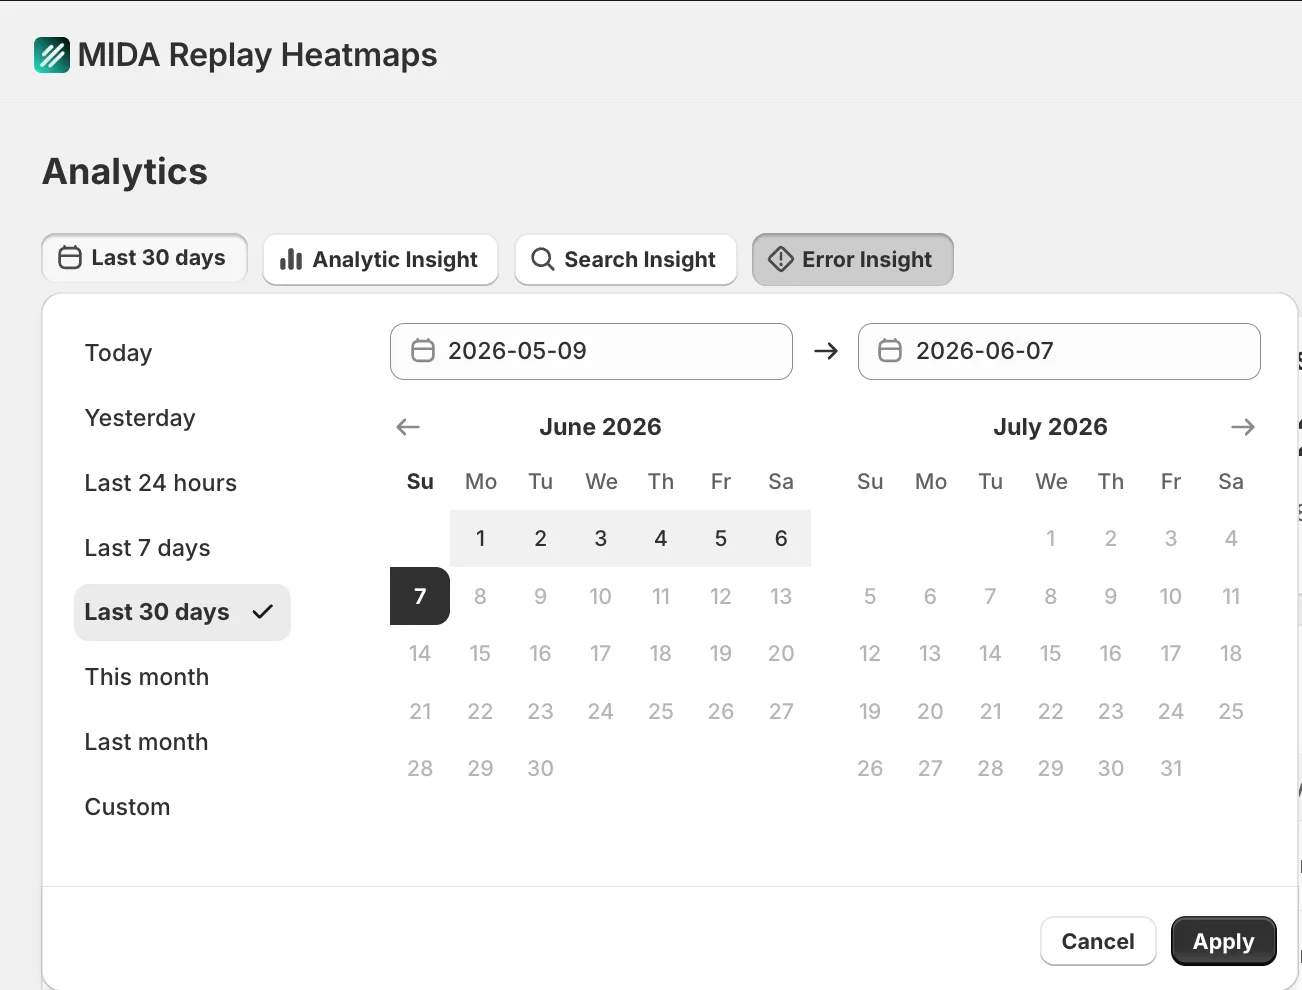
You can filter by default presets or set a custom range in the calendar. Please note that you cannot select future dates. All data on the page is synced to the selected date range.
Step 3: Explore the insights from the provided metrics.
Analytics Overview
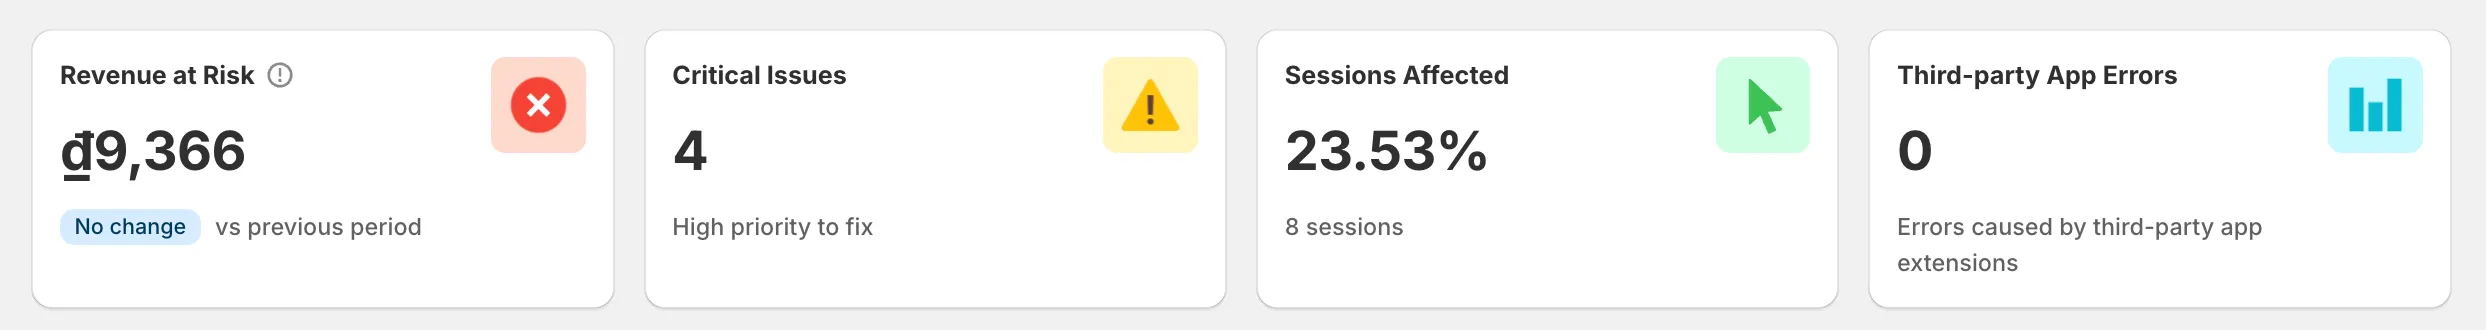
Section titled “Analytics Overview”At the top of the dashboard, you can see 4 metric cards that give you a quick overview of error impact on your store.
-
Revenue at Risk: Estimated transaction value affected by errors that happened before purchase completion. The subtitle compares this with the previous period. Since this is a risk metric, an increase is shown as negative (red) and a decrease as positive (green).
-
Critical Issues: The number of unique critical error types detected in the selected date range (e.g. add-to-cart failure, checkout failure, JavaScript runtime error). The same error type repeated within a session counts as one.
-
Sessions Affected: The percentage of sessions that experienced at least one error, with the actual number of affected sessions shown below.
-
Third-party App Errors: The total number of errors caused by third-party app extensions, detected via the
ui_extension_erroredevent.
💡 Hover over the tooltip icon on Revenue at Risk to see what the metric measures.
Revenue Killers
Section titled “Revenue Killers”This table lists the errors that directly impact your revenue and conversion, sorted by impact (highest first). Errors of the same type and location are grouped into a single record.
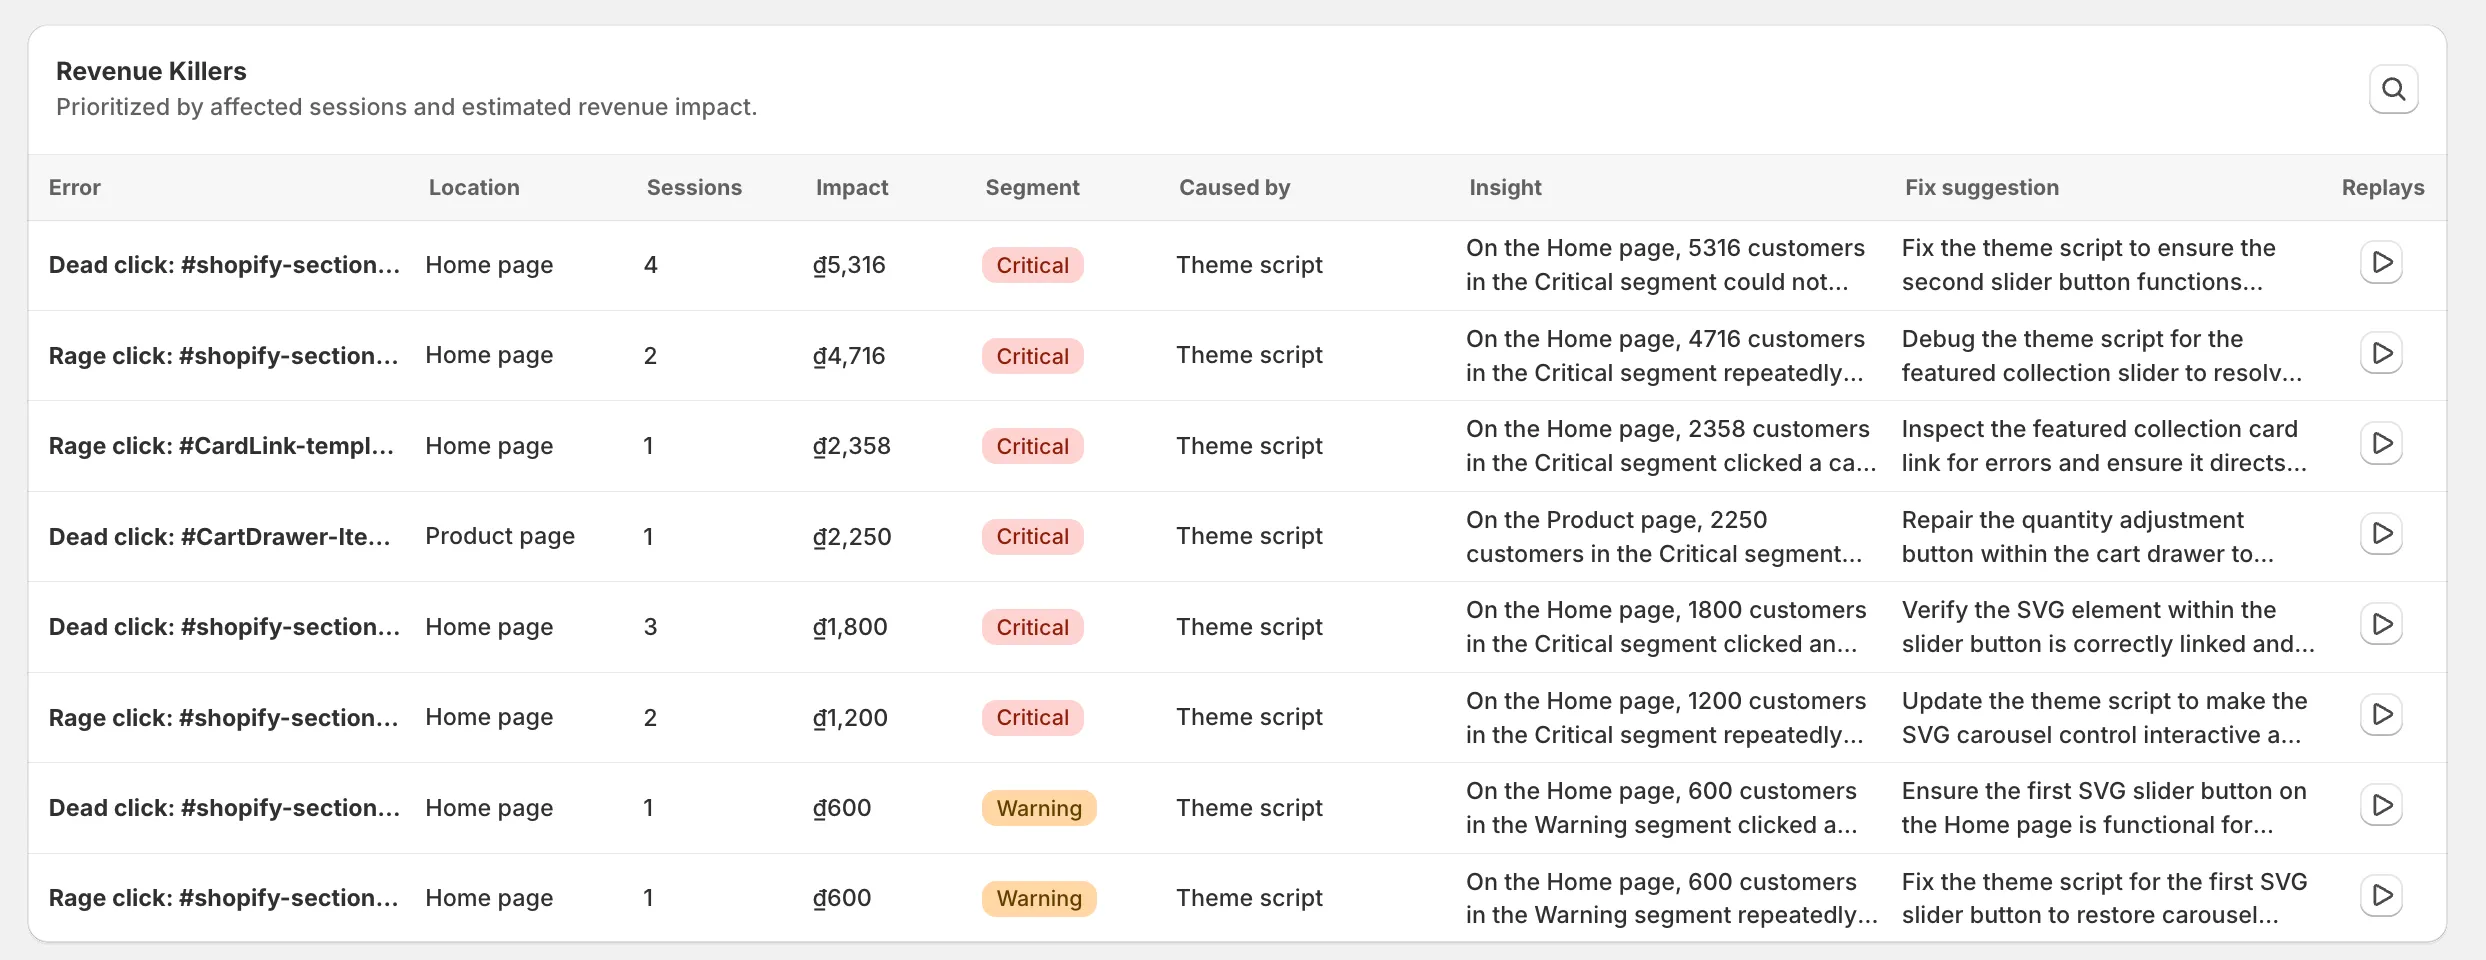
The table includes the following columns:
- Error: The error type and the affected element.
- Location: The page where the error occurred.
- Sessions: Number of sessions that experienced this error group.
- Impact: The revenue at risk for this error group.
- Segment: Severity badge — Critical or Warning.
- Caused by: The source of the error if identified (e.g. an app name or “Theme script”). Shows “Unknown” if the source cannot be determined.
- Insight: A short AI-generated note about the error pattern (device, page, or user behavior).
- Fix suggestion: A short, actionable AI-generated recommendation to fix or investigate the error.
- Replays: Open the session replays related to this error group.
💡 You can search the table by error name, location, caused by, or segment.
🔒 AI Assistant add-on required. The Insight and Fix suggestion columns are only available with the AI Assistant add-on active. Without it, this content is locked and you’ll see a prompt to upgrade.
An error group is marked Critical when it affects at least 5% of total sessions or accounts for at least 10% of total revenue at risk. Otherwise it is marked Warning.
Click the Replays icon on any row to open the replays filtered to that specific error and location.
Third-party App Health
Section titled “Third-party App Health”This section evaluates how stable your third-party app extensions are, based on ui_extension_errored events.
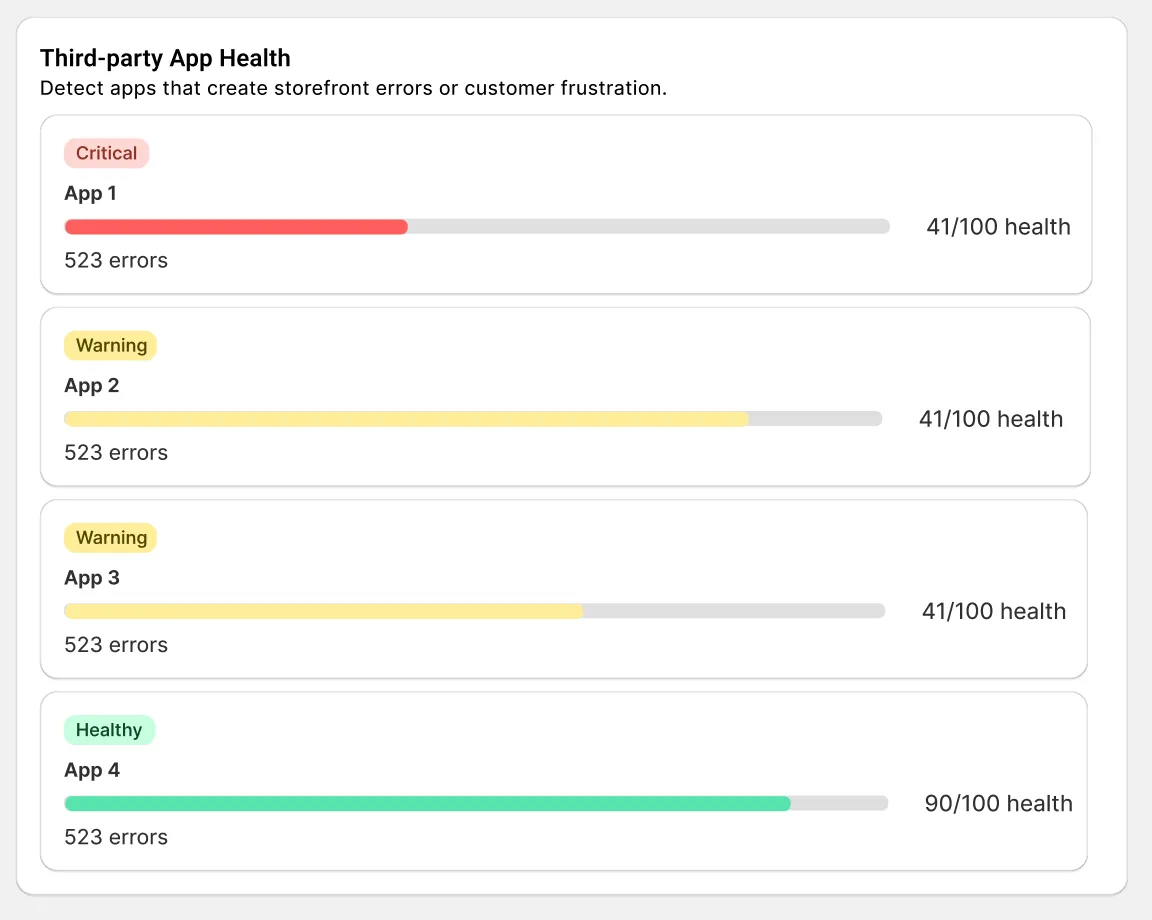
Each app is shown as a record with a status badge, app name, error count, and a health score bar.
- Health Score is calculated as
100 - Affected Sessions(minimum 0, maximum 100), displayed asXX/100 Health. - Status is based on the score: Healthy (≥80), Warning (50–79), Critical (<50).
- Apps are sorted by risk, with the lowest health score shown first.
If no
ui_extension_erroredevents are found, an empty state is shown instead.
Revenue at Risk Timeline
Section titled “Revenue at Risk Timeline”This bar chart shows the trend of revenue at risk over time, displaying up to the last 10 days in the selected date range.
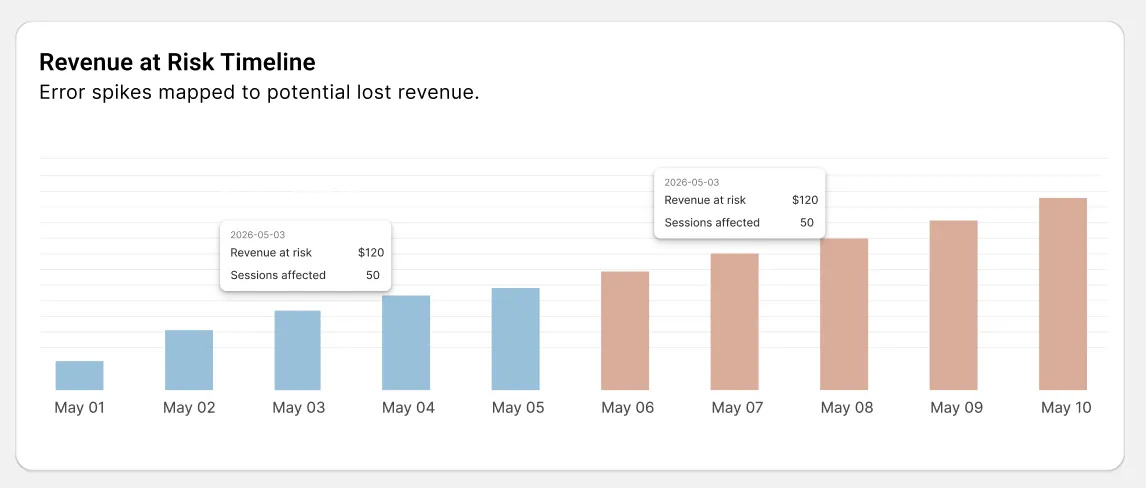
Hover over any bar to see the Date, Revenue at Risk, and Sessions Affected for that day.
Device & Browser Breakdown
Section titled “Device & Browser Breakdown”These pie charts show the distribution of errors across devices (Mobile, Desktop, Tablet) and browsers (Chrome, Safari, Edge, Firefox, Opera, IE, Unknown), based on the total error sessions in the selected date range.
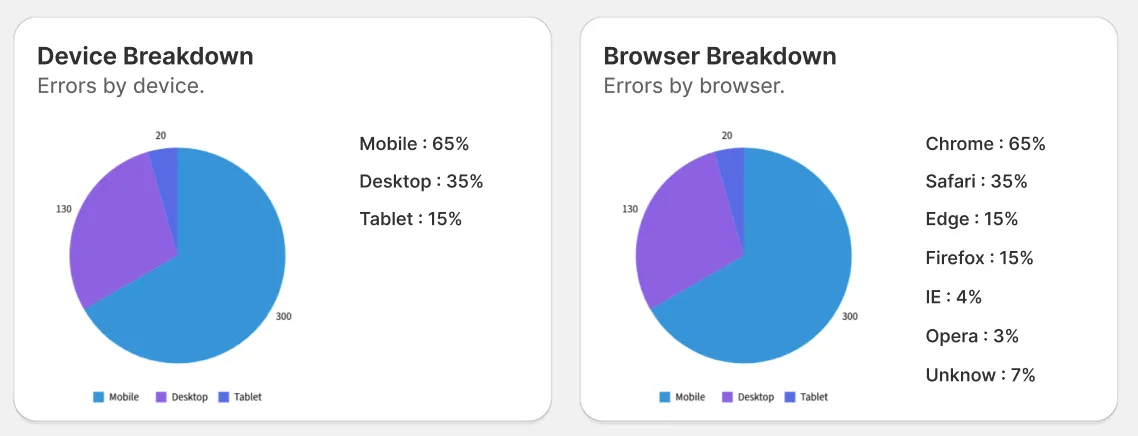
Hover over any segment of a chart to see the number of error sessions for that device or browser.
Critical Replays
Section titled “Critical Replays”This card highlights up to 3 sessions with the highest impact, so you can quickly investigate the most important errors.
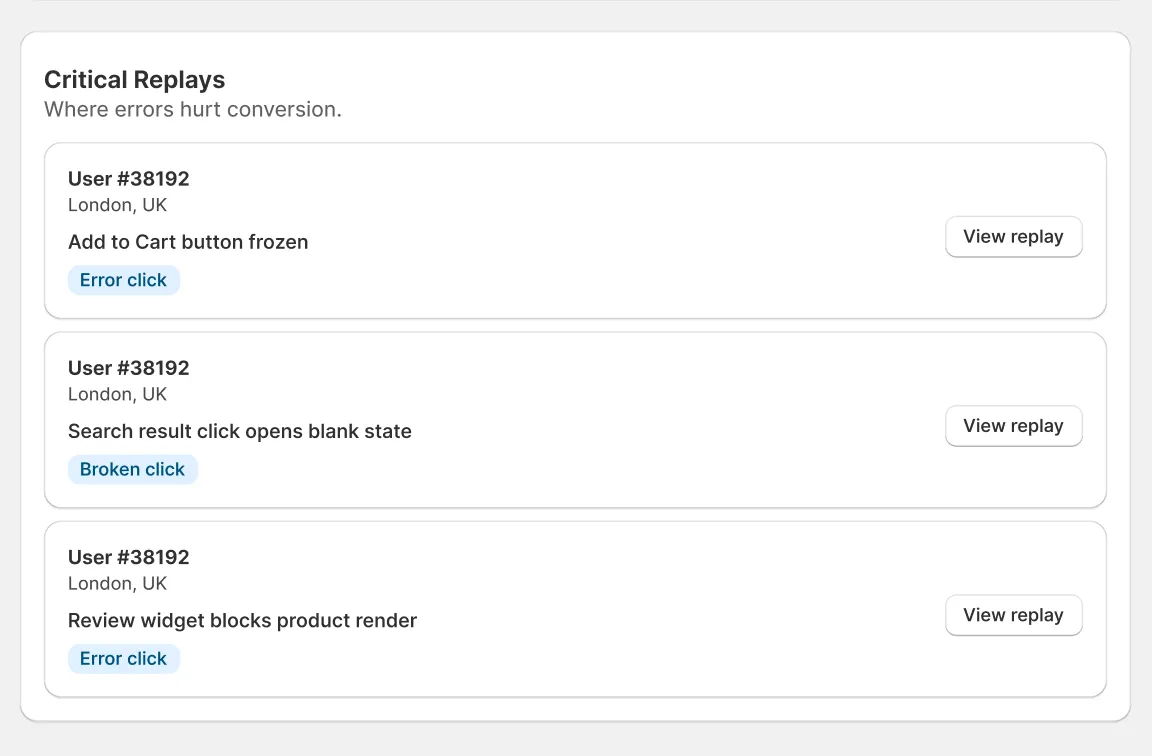
Sessions are prioritized by highest revenue at risk, then most errors, then most recent. Each replay card shows the user ID or customer name, location (if available), and a representative error label.
Click View Replay to open the session replay, starting at the moment the error occurred when that data is available.
Funnel Error Map
Section titled “Funnel Error Map”This card shows where errors appear across your conversion funnel (Homepage, Collection, Product, Cart, Checkout), helping you see which step is most affected.
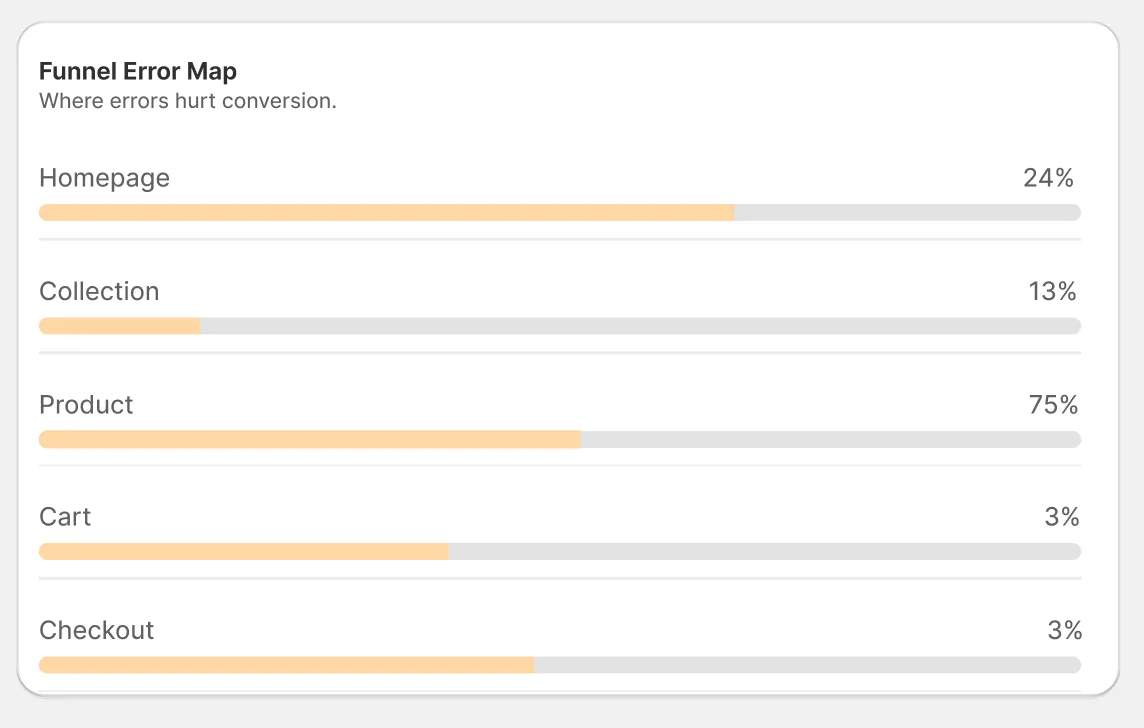
Each step shows its error percentage and a progress bar. The error percentage is calculated as the share of error sessions at that step out of total error sessions. Steps are always shown in funnel order, not sorted by percentage.
If you have any questions, feel free to contact us via Crisp Chat or email us at [email protected].